
Fig. 2
- ID
- ZDB-IMAGE-180209-2
- Publication
- Botthof et al., 2017 - Loss of the homologous recombination gene rad51 leads to Fanconi anemia-like symptoms in zebrafish.
- All Figures
- Figures for Botthof et al., 2017
|
Fig. 2
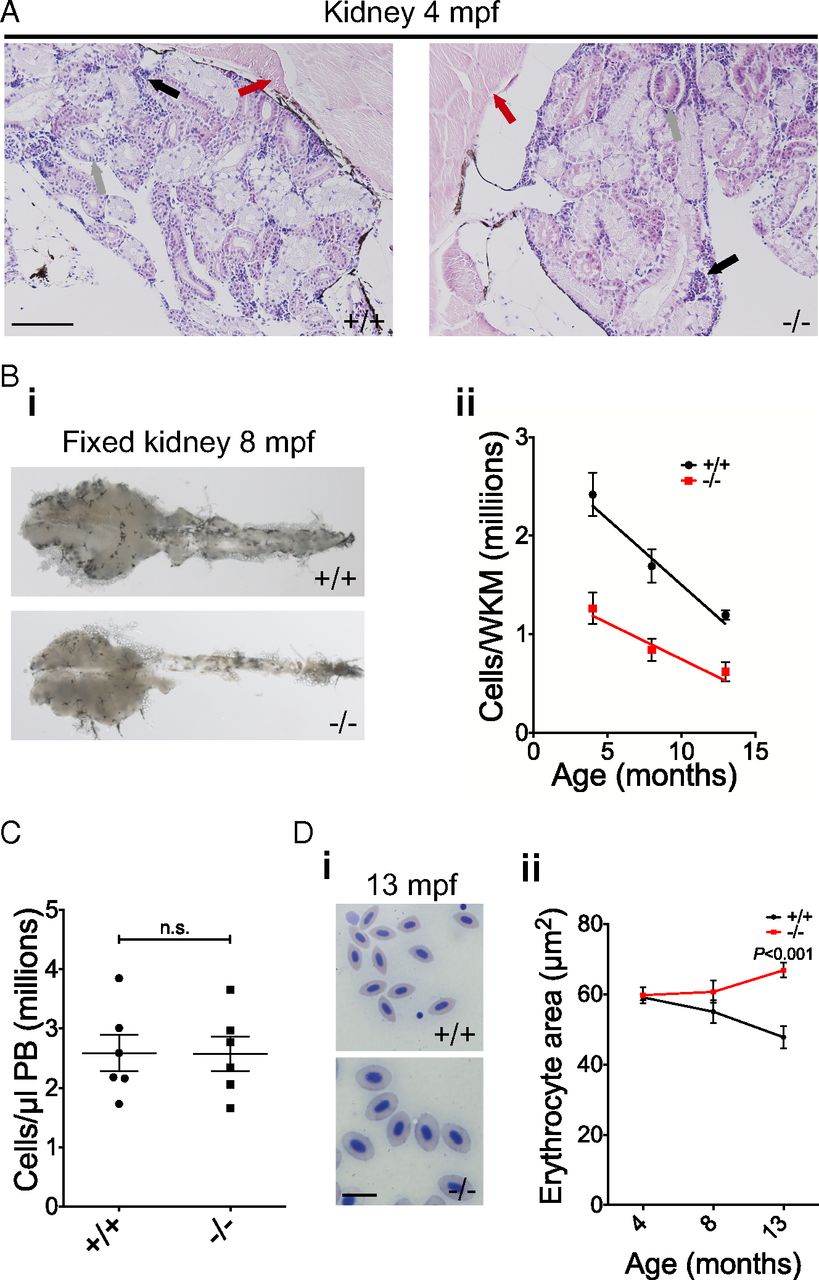
Adult rad51 mutant fish display kidney marrow cytopenia. (A) H&E-stained histological sections of 4-mpf WT and mutant kidneys using a 20× objective. Muscle (red arrow), ducts/tubules (gray arrow), and hematopoietic kidney marrow (black arrow) can be seen. (Scale bar, 100 µm.) (B) Fixed 8-mpf WT and mutant kidneys (i) (magnification, 10×); quantification of the number of total cells per freshly isolated kidney at different ages using a hemocytometer (ii). Two-way ANOVA was used and type III model fit [Armitage et al. (73)]. The test shows a significant influence of age [F(1, 50) = 18.23, P < 0.0001] and mutation status [F(1, 50) = 10.87, P = 0.0018] on phenotype. Four months postfertilization n+/+ = 6, n−/− = 6; 8 mpf n+/+ = 16, n−/− = 16; 13 mpf n+/+ = 6, n−/− = 4. (C) Quantification of PB cells in WT and mutant fish at 4 mpf. Two-sided t test, n+/+ = 6, n−/− = 6. n.s., not significant. (D) In i, blood smears of 13-mpf WT (Upper) and mutant fish (Lower) are compared. (Scale bar, 10 µm.) In ii, the change is quantified using two-way ANOVA and a type III model fit [Armitage et al. (73)]. There was a statistically significant interaction between age and mutation status [F(1, 28) = 12.89, P = 0.0012], no significant influence of age [F(1, 28) = 180.76, P = 0.392] and no significant influence of mutation status [F(1, 28) = 2.88, P = 0.1006]. P value shown on the graph stems from a post hoc Tukey multiple-comparison test. Four months postfertilization: n+/+ = 6, n−/− = 6; 8 mpf: n+/+ = 5, n−/− = 5; 13 mpf: n+/+ = 6, n−/− = 4. Bars represent mean ± SEM.