
Fig. S3
- ID
- ZDB-IMAGE-180206-3
- Publication
- Singh et al., 2017 - Different developmental histories of beta-cells generate functional and proliferative heterogeneity during islet growth
- All Figures
- Figures for Singh et al., 2017
|
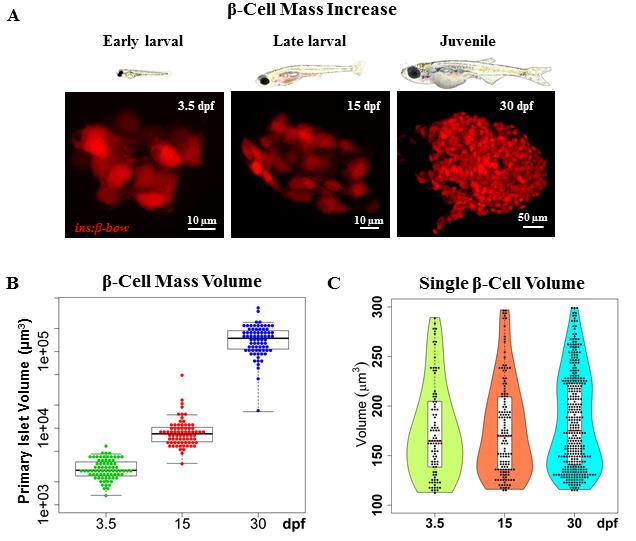
Fig. S3
The increase in beta-cell mass during zebrafish development occurs in the absence of beta-cell hypertrophy. (A) Top – cartoons (to scale) depicting zebrafish at three stages of development: 3.5, 15 and 30 dpf. Bottom - representative maximum intensity projections of the primary islet from Tg(ins:BB1.0L) at each stage. (B) Quantification of the total beta-cell mass in the primary islet during zebrafish development. The plot shows tukey style boxplot overlaid with the data points. This analysis shows a 3-fold increase from 3.5 to 15 dpf, and a 16.7-fold increase from 15 to 30 dpf; resulting in a total increase of approximately 50-fold over the observed period. (C) Quantification of single beta-cell volume during the three stages of zebrafish development. Violin plots show the probability density (distribution) of cell sizes at each stage. The median and mean single-cell volume does not statistically differ among the three stages. To mark beta-cells in multiple colors in order to measure single beta-cell size, beta-bow recombination was induced using 4-OHT-treatment at 24 hpf. Scale bars, 10 μm.