
|
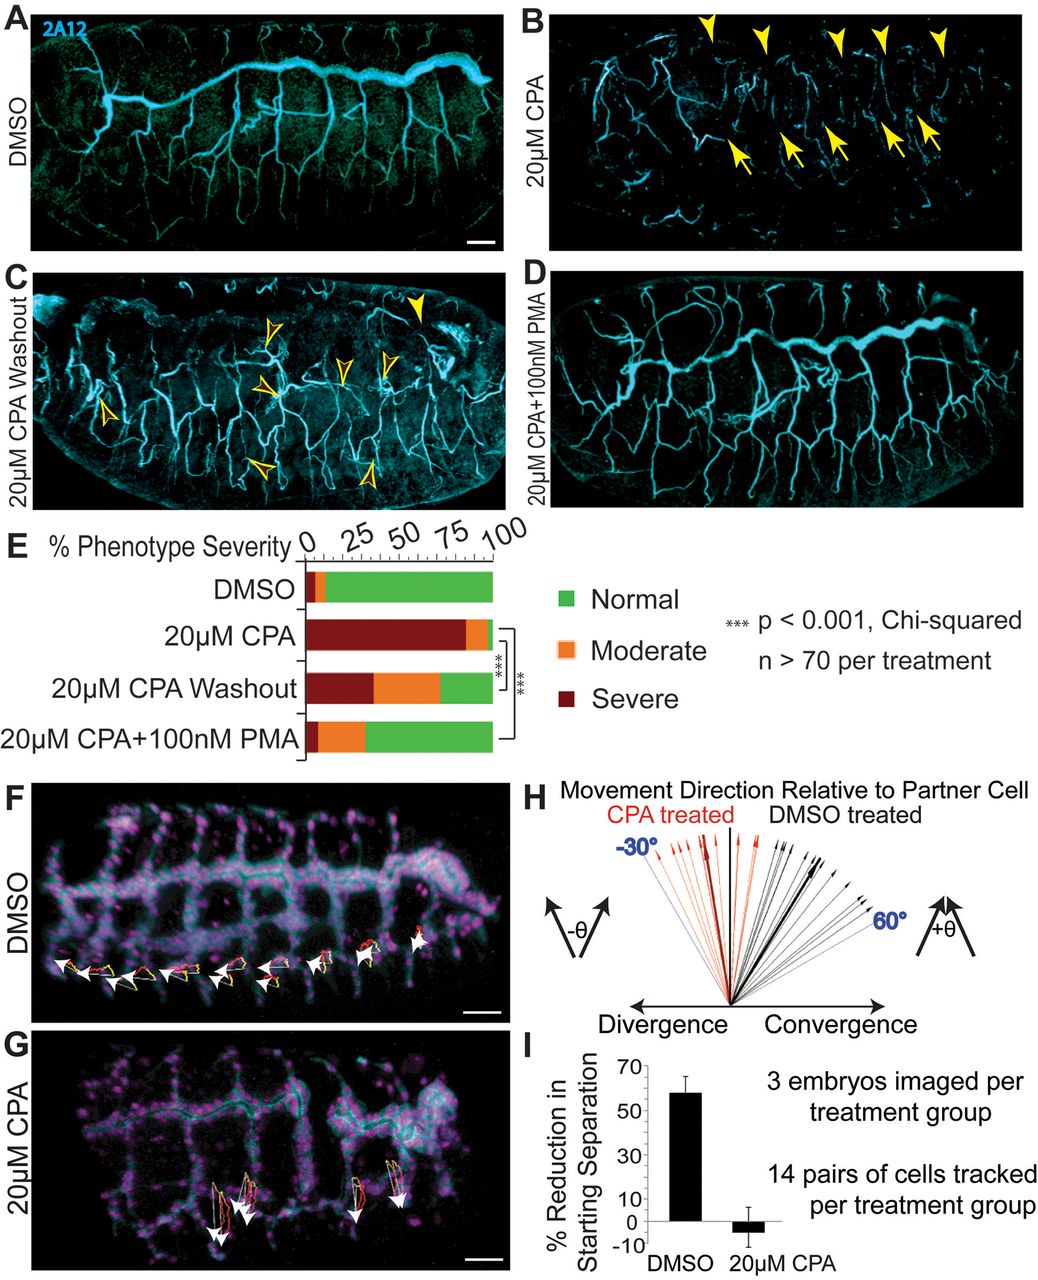
Fig. 2 SERCA regulates cell migration to control budding, even in the absence of proliferation. (A-E) SERCA blockade reversibly disrupts Drosophila tracheogenesis and PMA rescues this. Whole mount Drosophila embryos at stage 15-16 are viewed from the lateral aspect, anterior left, and the 2A12 antibody stains for tracheal lumen protein following the indicated treatments. (A) DMSO-treated controls display orderly tracheal branches. (B) 20 µM CPA disrupts branching, resulting in gaps in the dorsal trunk (arrowheads) and subsidiary branches (arrows). (C) CPA washout at stage 12 results in fewer breaks (solid arrowhead) and undulating branches with extended sprouts (open arrowheads). (D) PMA with CPA rescues tracheal budding defects. Occasionally, an embryo treated with CPA+PMA or one from which CPA was washed out exhibits a phenotype of excess tracheal cell migration (see Movie 8). (E) Severity of phenotypes was scored for each treatment. Both washout and PMA rescue versus CPA alone significantly reduce the proportions of embryos in higher severity groups (P<0.001; Chi-squared; n>70 per treatment). (F-I) Live imaging shows SERCA is necessary for airway cells to converge during completion of Drosophila tracheogenesis. (F-G) The trajectories (white arrows) and yellow-to-red migration paths are shown for individual cells that form the tracheal lateral trunk from stage 14 to early 16. The displacements shown represent cell movement over 100 min. (F) Cells from adjacent segments in DMSO-treated wild-type embryos converge. (G) During SERCA blockade, tracheal cells lack active migration and slightly diverge as the embryo develops. (H) For pairs of tracheal cells in adjacent segments, the direction of travel of one cell relative to the other was calculated, and a vector was plotted for each pair to compare the movements of all pairs from each treatment together, demonstrating the angles of convergence (controls) or divergence (CPA-treatment) of these cells. (I) The plot shows mean and standard deviation of the convergence, or % reduction in starting separation, of pairs of adjacent cells. Controls reduce their starting separation 58%, while CPA treatment blocks active migration and the cells diverge (the mean is negative). Scale bars: 25 µm throughout.