
|
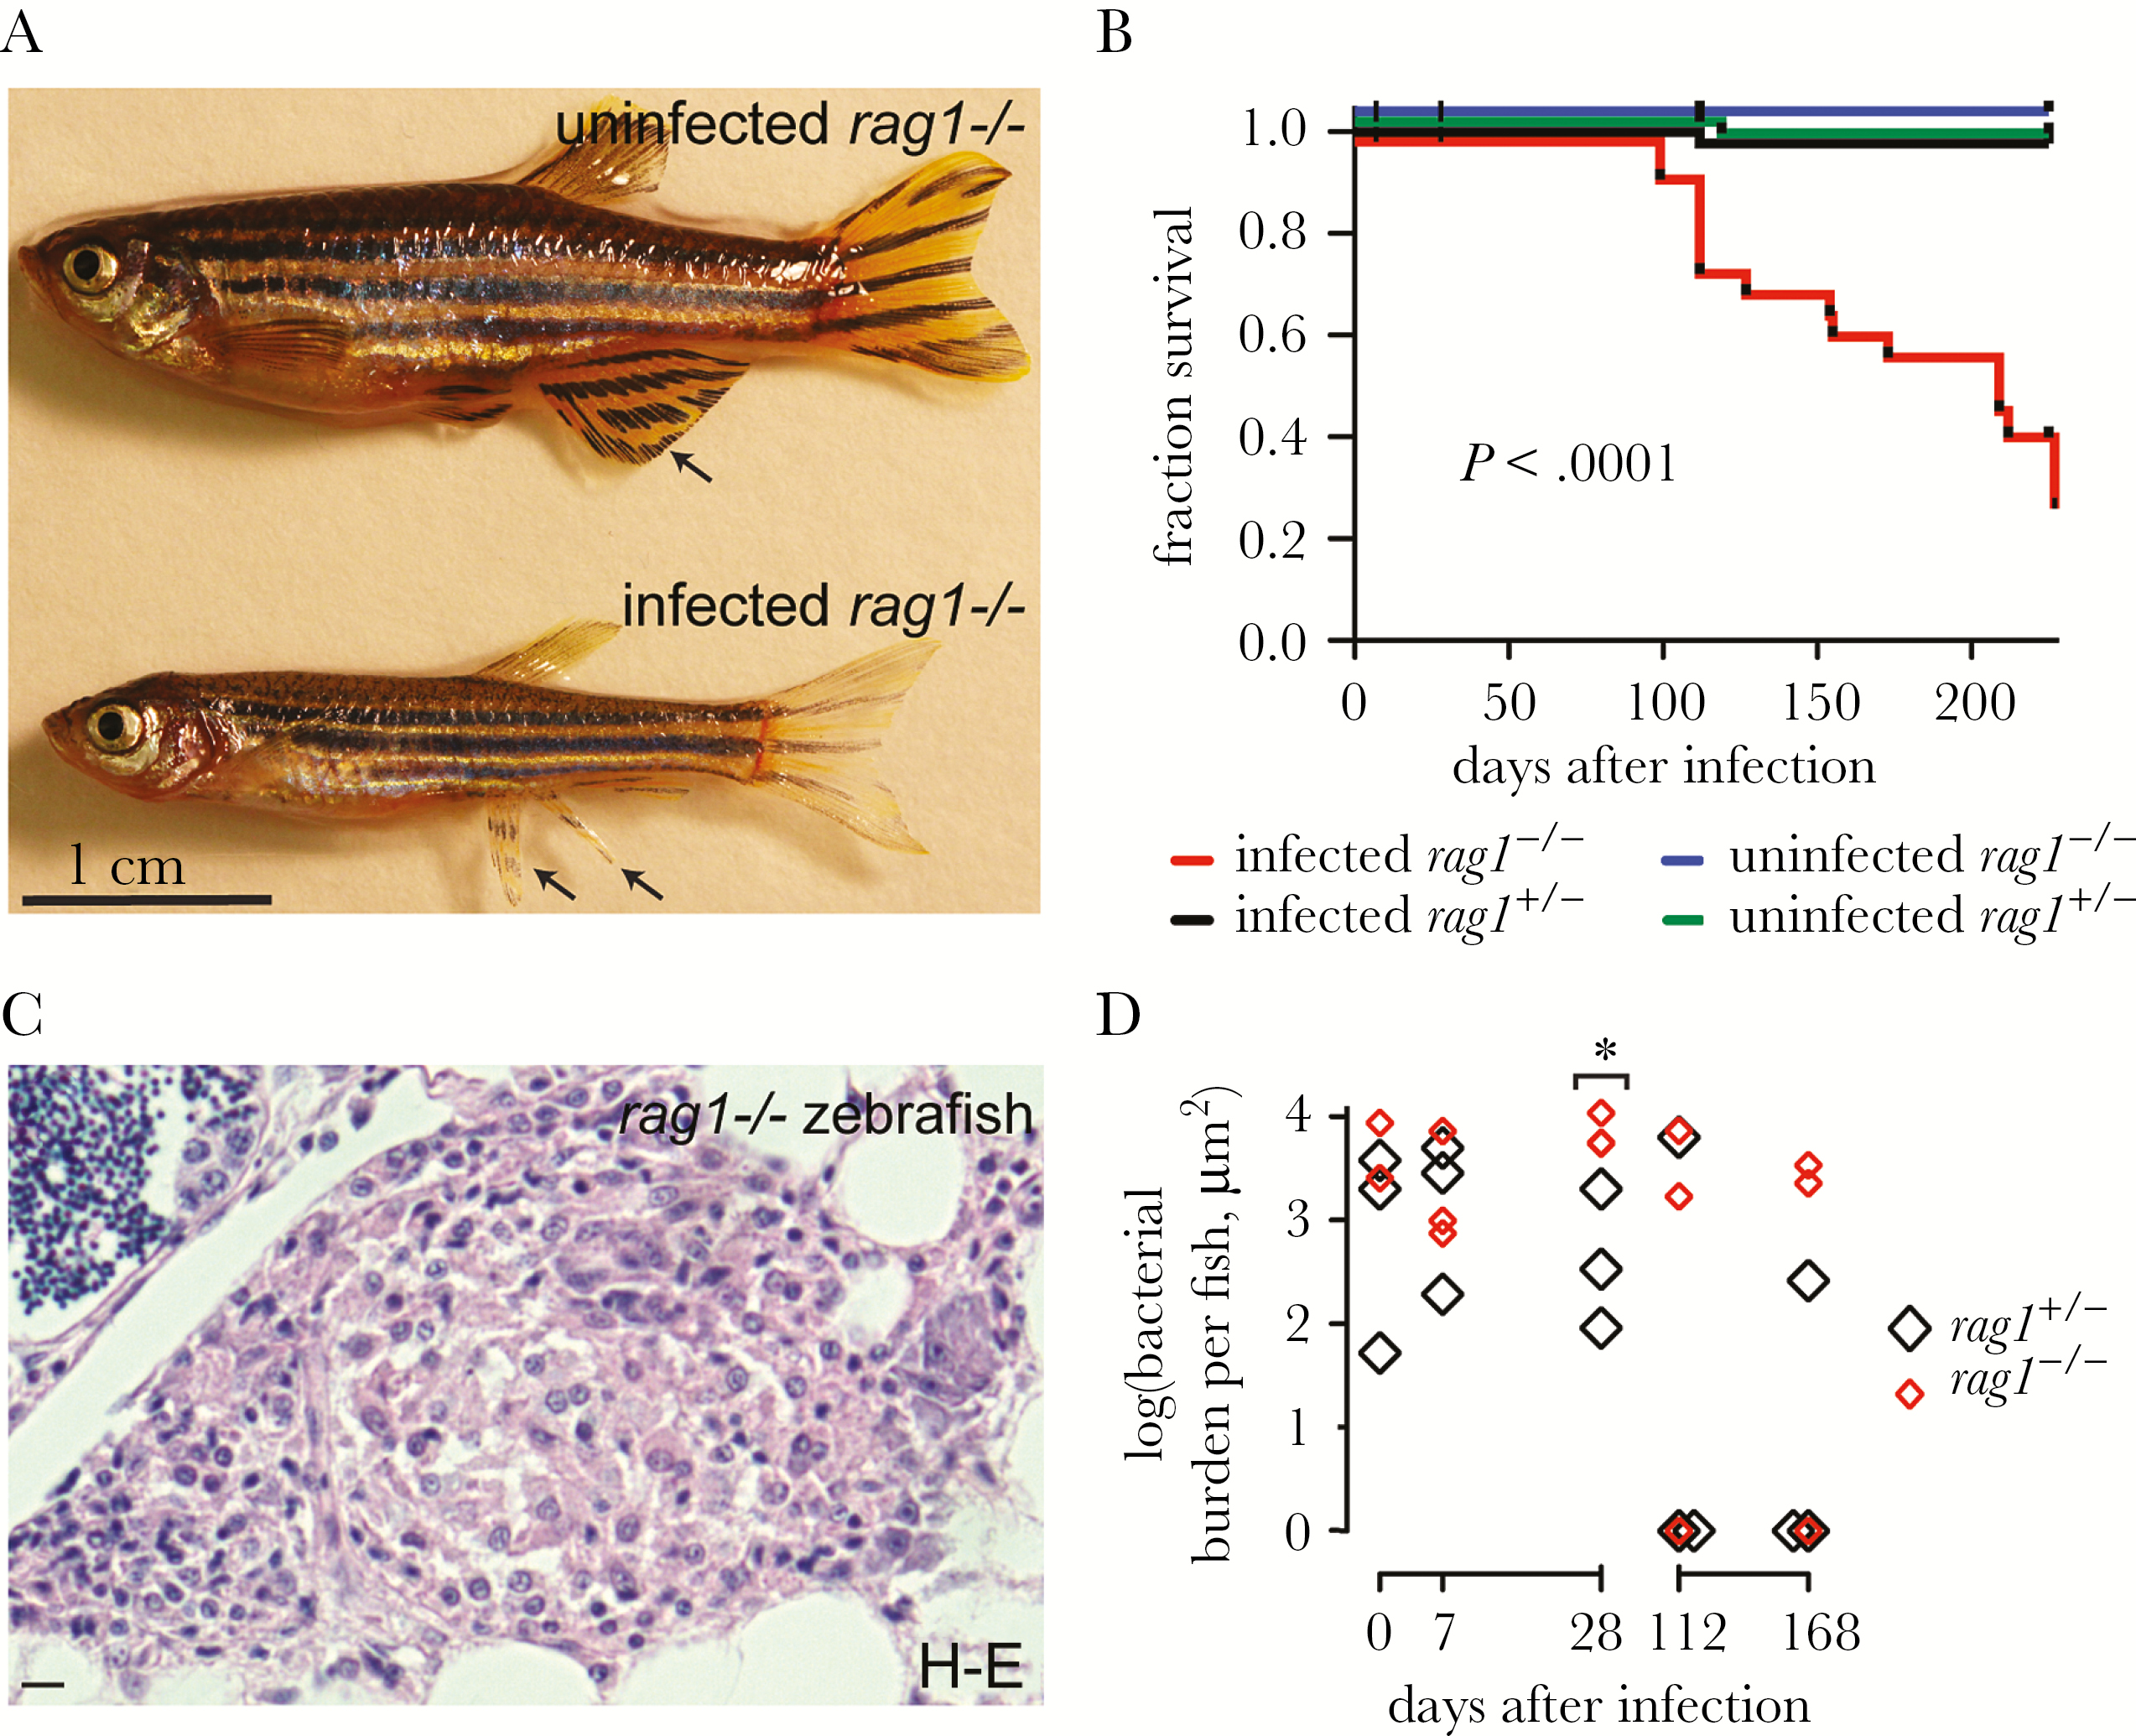
Fig. 2
Adaptive immunity contributes to control of Mycobacterium leprae infection. A, Representative images of sibling uninfected and infected rag1 mutant animals approximately 100 days after infection; the M. leprae–infected animal is smaller than the uninfected animal. Arrows indicate an intact fin in the uninfected animal and a frayed fin in the infected animal. B, Kaplan-Meier survival curve of sibling rag1 heterozygote and mutant zebrafish with or without infection due to M. leprae as described in Figure 1A. There were 61 uninfected heterozygotes, 20 infected heterozygotes, 57 uninfected mutants, and 41 infected mutants. C, Hematoxylin-eosin (H-E)–stained section of a rag1 mutant zebrafish granuloma, infected as described in Figure 1A. Bar denotes 10 μm. D, Quantification of bacterial burden per fish in rag1 heterozygotes and mutants. *P = .03, by the Student t test, comparing heterozygotes to mutants at each time point. Other comparisons were not significant.