
|
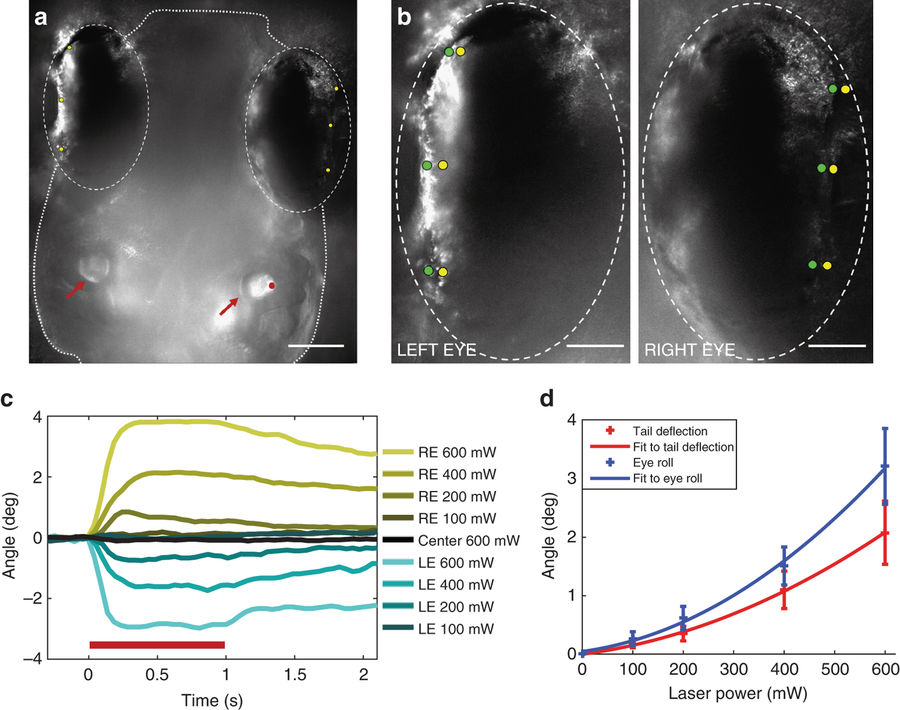
Fig. 4
Otolith trapping results in coordinated compensatory movements in eyes. a Dorsal view of a larva. Otoliths (red arrows), the position of the trap on the lateral edge of the right otolith (red dot), and pigment landmarks on the eyes (yellow dots) are indicated. Scale bar, 100 µm. b Positions of pigment landmarks from a before (yellow) and during (green) a 600 mW trap. Scale bar, 50 µm. c Rotation of the left (LE, blue) and right (RE, yellow) eyes vs. the midline at a range of trap powers (average of three trials from one larva). Responses for all larvae are shown in Supplementary Fig. 6. d Average across all fish (n = 5) of the maximum deflection angle for the tail in red, and maximum eye roll in blue. Second order polynomial curves fitting these data are shown, and SEM is indicated for each power