
Fig. 7
- ID
- ZDB-IMAGE-180131-8
- Antibodies
- Publication
- Escobar-Aguirre et al., 2017 - Microtubule-actin crosslinking factor 1 (Macf1) domain function in Balbiani body dissociation and nuclear positioning
- All Figures
- Figures for Escobar-Aguirre et al., 2017
|
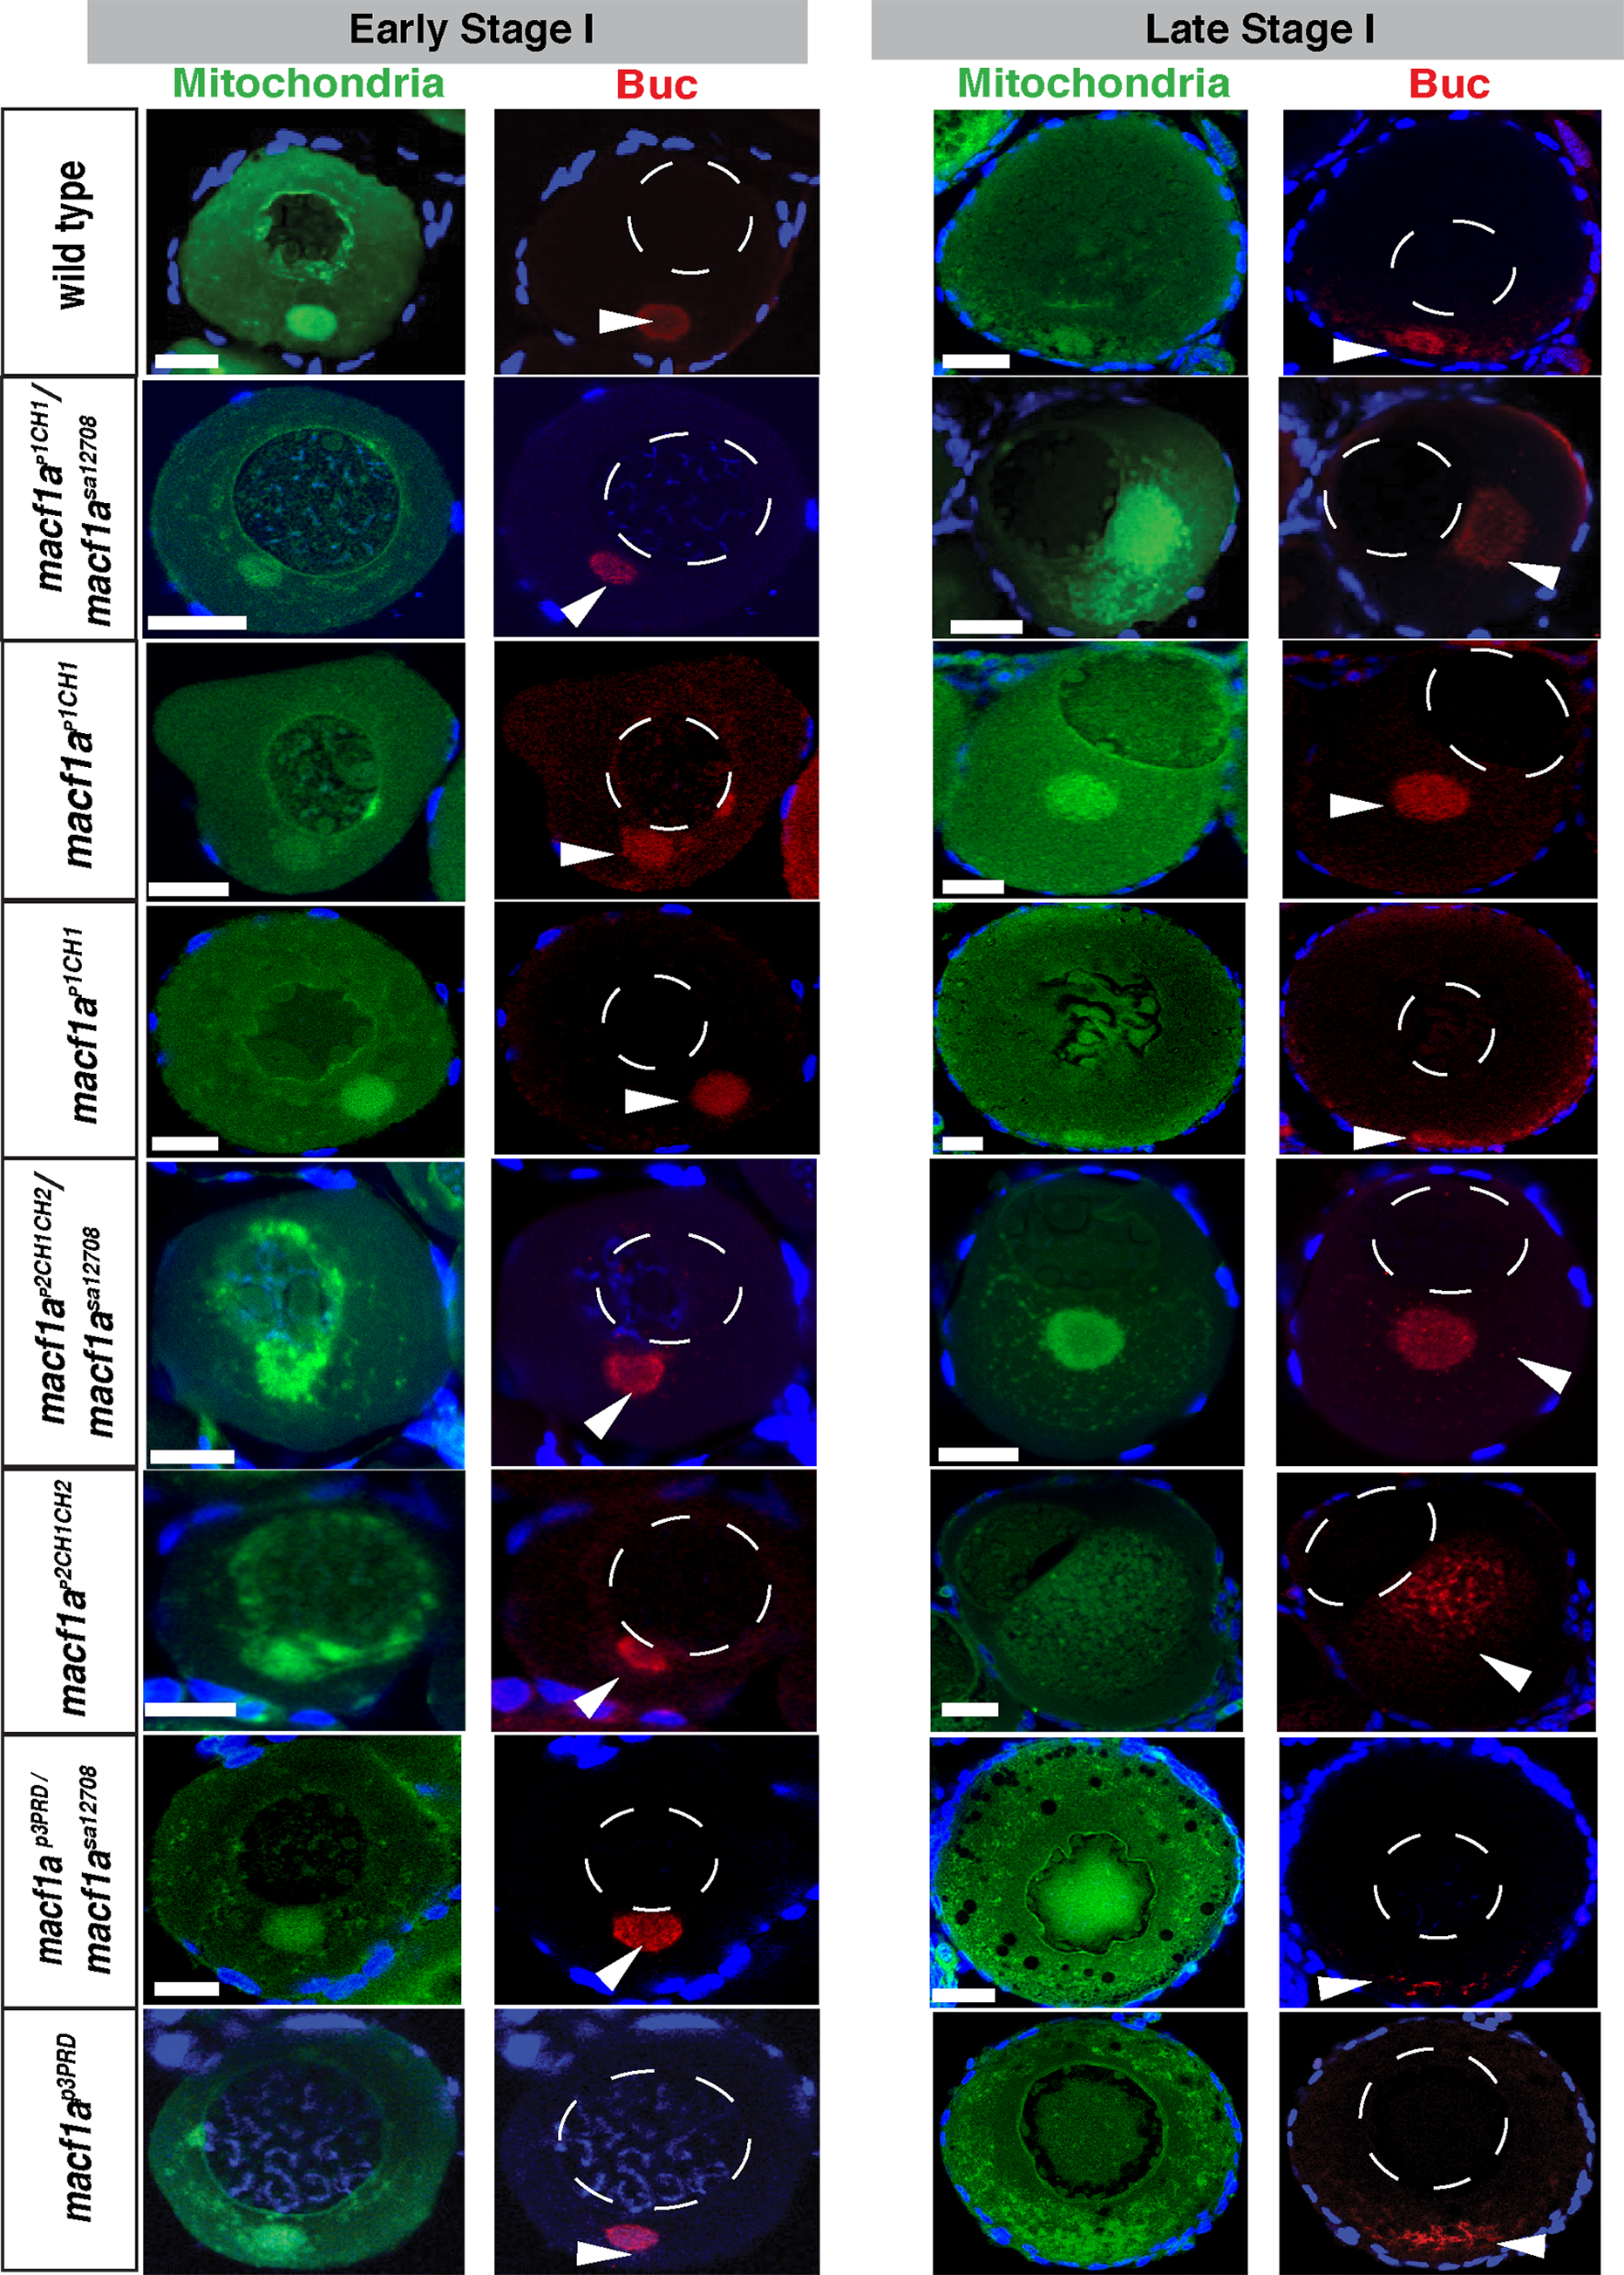
Fig. 7
Characterization of macf1ap1CH1, macf1ap2CH1CH2 and macf1ap3PRD mutants.
DiOC6 (mitochondria, green) and Buc (red) staining in early and late stage I oocytes. macf1ap1CH1 /macf1asa12708 and macf1ap2CH1CH2 /macf1sa12708 ovaries display a macf1a null phenotype, whereas macf1ap3PRD / macf1sa12708 show no phenotype. macf1ap1CH1 ovaries showed incomplete penetrance, displaying either a WT or a macf1a null phenotype. macf1ap2CH1CH2 oocytes displayed a macf1a null phenotype, and macf1ap3PRD showed no phenotype. DiOC6 and Buc; N≥ 3 ovaries of each genotype, 31 macf1ap1CH1, 25 macf1ap1CH1/macf1asa12708, 11 macf1ap2CH1CH2/ macf1asa12708, 22 macf1ap2CH1CH2, 15 macf1ap3PRD/macf1sa12708 and 24 macf1ap3PRD oocytes. DAPI (blue) stains the DNA. Dotted white lines outline the nucleus. Images are single optical sections. Arrowheads in indicate the Bb, and in B the egg cytoplasm. Scale bar: 20 μm.