
Fig. 3
- ID
- ZDB-IMAGE-180130-11
- Publication
- Aose et al., 2017 - The occhiolino (occ) mutant zebrafish, a model for development of the optical function in the biological lens
- All Figures
- Figures for Aose et al., 2017
|
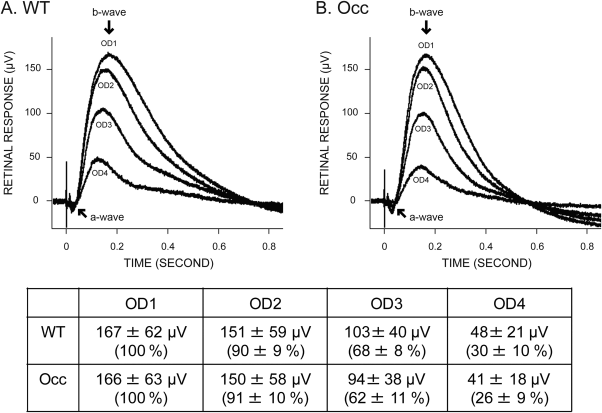
Fig. 3
ERGs determined that retinal function in the occ mutant resembles that in the wt Zebrafish. ERGs were conducted on wt and occ eyes at 5–6 dpf using four different stimulus intensities. OD is the optical density, where OD1 is the brightest light intensity and OD4 is the lowest light intensity. In both wt (A) and occ (B), a negative a-wave followed by a large b-wave was a measure of the photoreceptors and postsynaptic activity (ganglion cells), respectively. The normalized response for each illumination was plotted in the figures, and the recorded values were listed in the table. The similarities in the magnitude and the response of the ERGs to different illumination indicated that visual function in the occ and wt retinas was the same. The visual deficit in the occ mutant was not the result of abnormal retinal function.