
|
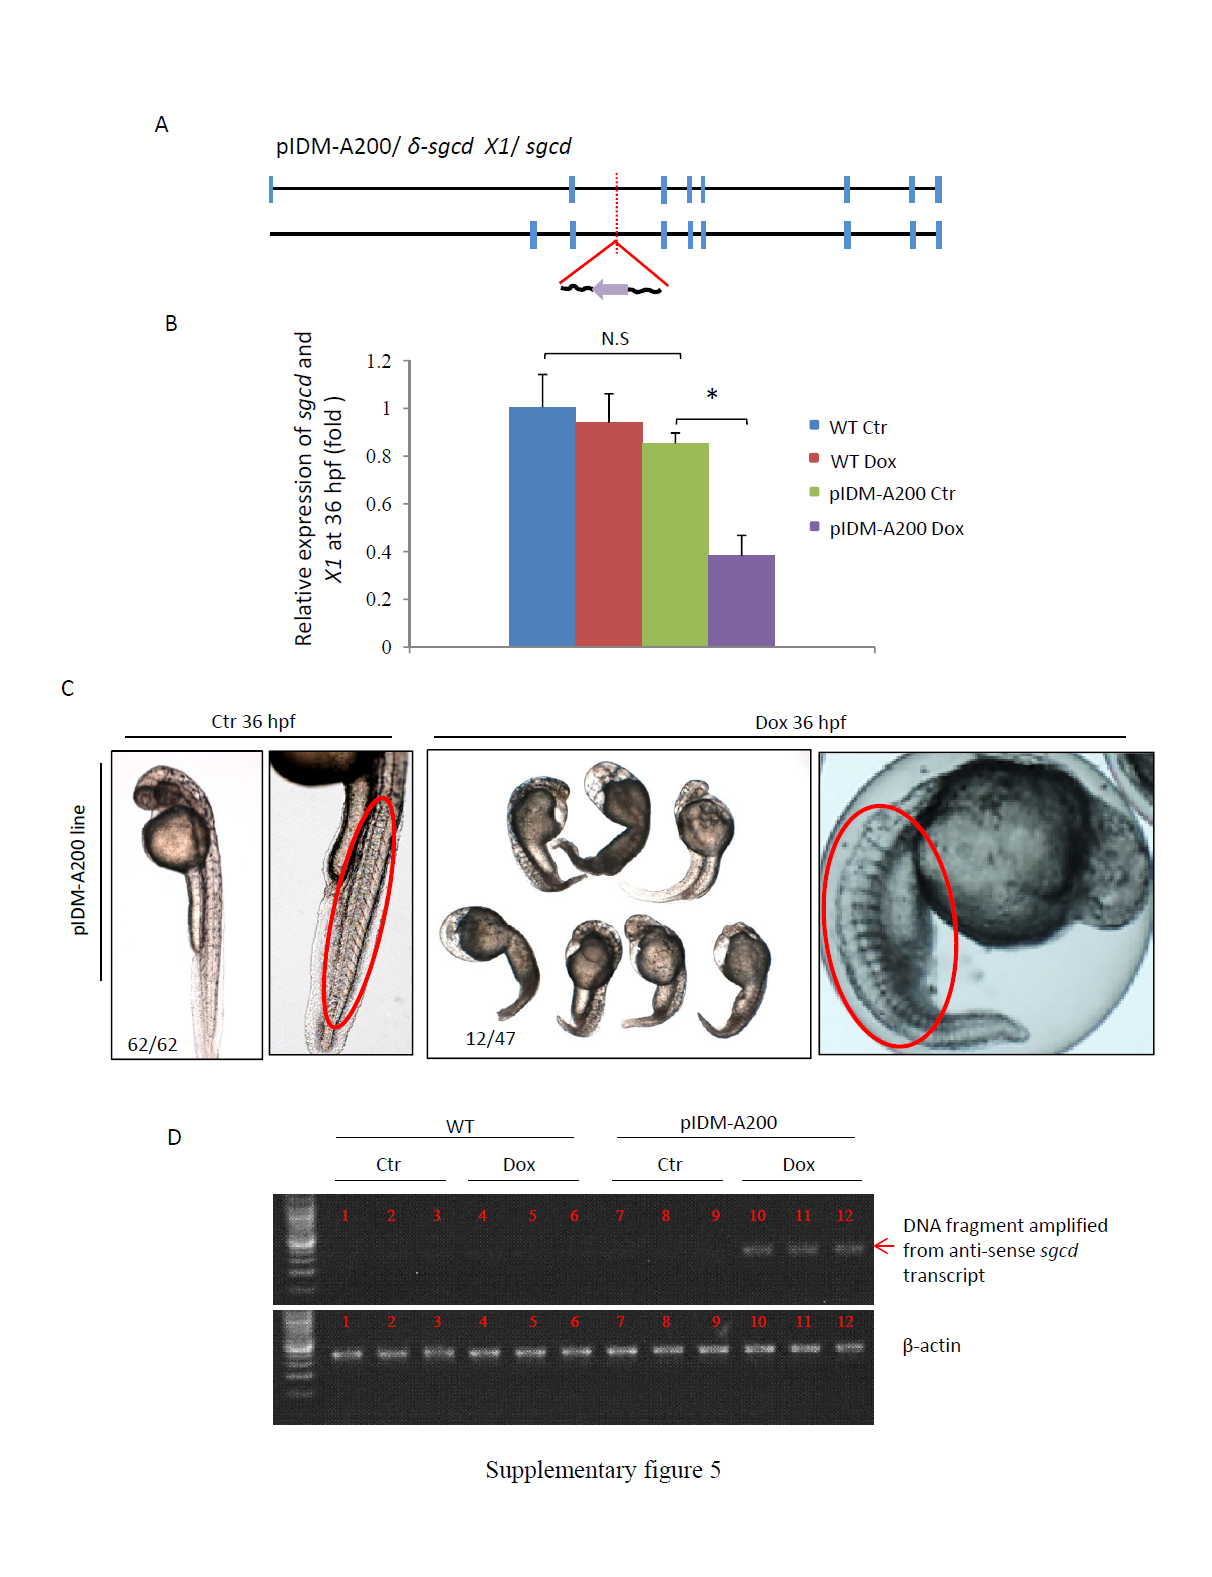
Fig. S5
Supplementary information for line pIDM-A200. (A) Diagram showing the position and orientation of pIDM in the δ-sgcd genomic DNA (including two isoforms, δ-sgcd and X1). (B) The relative expression levels of total δ-sgcd and X1 transcripts were analyzed with specific primers at 48 hpf. β-actin was used to normalize the total RNA. (C) Pictures of pIDM-A200 embryos treated or untreated with Dox at 36 hpf. The enlarged pictures showed the abnormal muscular development phenotype (red oval). Number, type of represented embryos/total embryos in F2 population. (D) The induction of the anti-sense transcript of sgcd in the pIDM-A200 embryos treated with Dox was analyzed with qRT-PCR using primer pairs sgcd-intron2-F and sgcd-intron2-R. For all analysis on the relative expression of the target genes the statistically significant differences between samples were assessed using independent-sample T-tests (*P<0.05, **P<0.01, ***P<0.001).