
IMAGE
Fig. S4
- ID
- ZDB-IMAGE-180126-25
- Publication
- Matsuoka et al., 2017 - CNS-resident progenitors direct the vascularization of neighboring tissues
- All Figures
- Figures for Matsuoka et al., 2017
Image
|
Figure Caption
Fig. S4
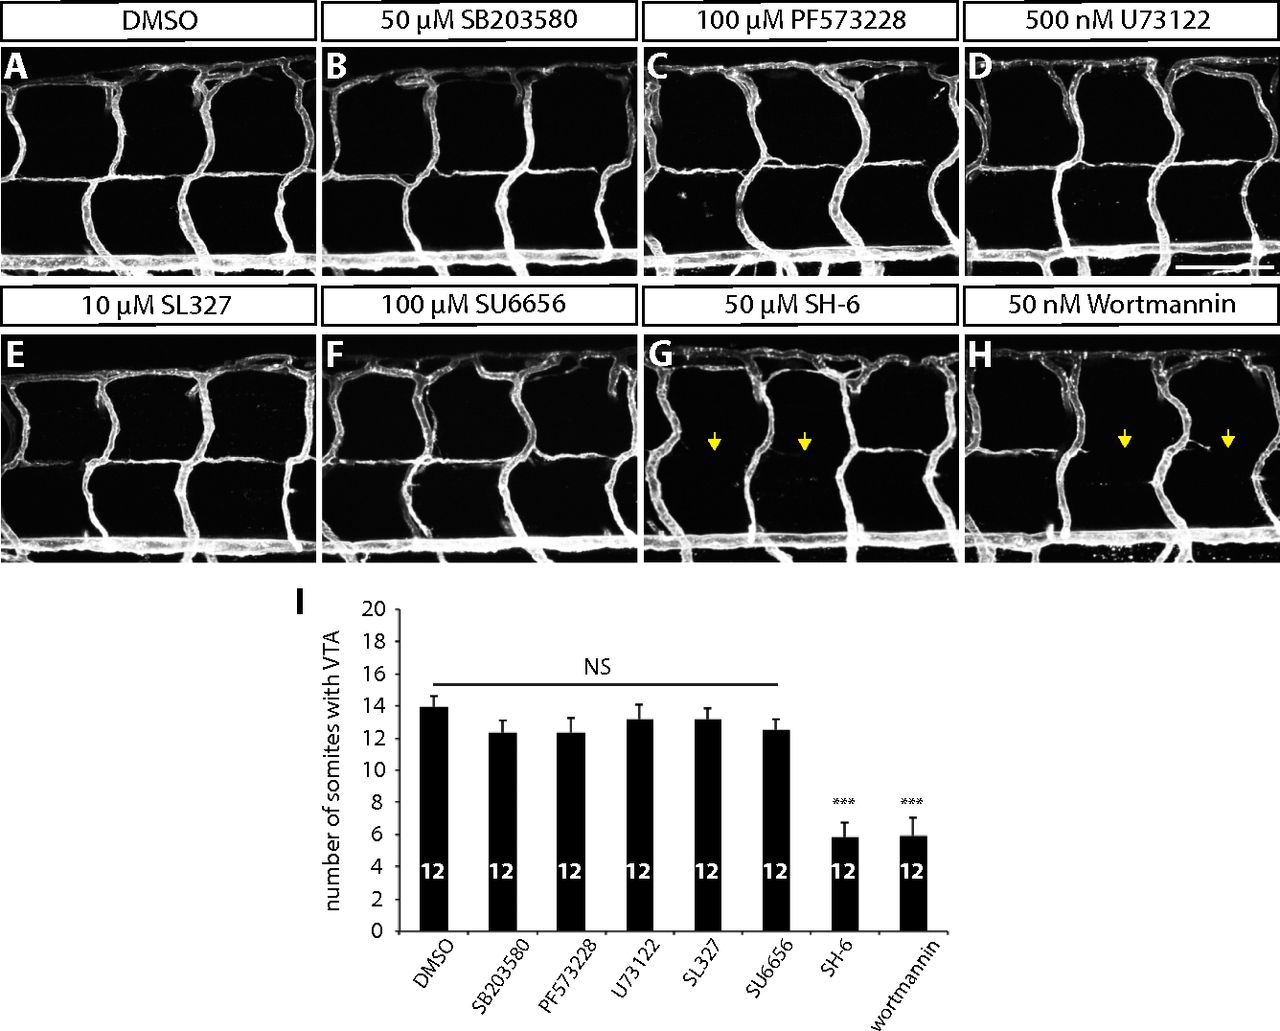
VTA formation in larvae treated with different small-molecule inhibitors. (A–H) 152 hpf Tg(kdrl:ras-mcherry) larval trunk vasculature after treatment with DMSO (A), SB203580 (B), PF573228 (C), U73122 (D), SL327 (E), SU6656 (F), SH-6 (G), and wortmannin (H) from 80 to 152 hpf. SH-6 and wortmannin treatments significantly inhibited VTA formation (yellow arrows). (Scale bar, 100 µm.) (I) Quantification of the average number of somites with VTAs for the experiments shown in A–H (20 somites examined per animal). Values represent means ± SEM (***P < 0.001 by ANOVA followed by Tukey’s HSD test).
Figure Data
Acknowledgments
This image is the copyrighted work of the attributed author or publisher, and
ZFIN has permission only to display this image to its users.
Additional permissions should be obtained from the applicable author or publisher of the image.
Full text @ Proc. Natl. Acad. Sci. USA