
IMAGE
Fig. 4
- ID
- ZDB-IMAGE-180123-14
- Genes
- Publication
- Zhang et al., 2017 - Inhibition of glutamate decarboxylase (GAD) by ethyl ketopentenoate (EKP) induces treatment-resistant epileptic seizures in zebrafish
- All Figures
- Figures for Zhang et al., 2017
Image
|
Figure Caption
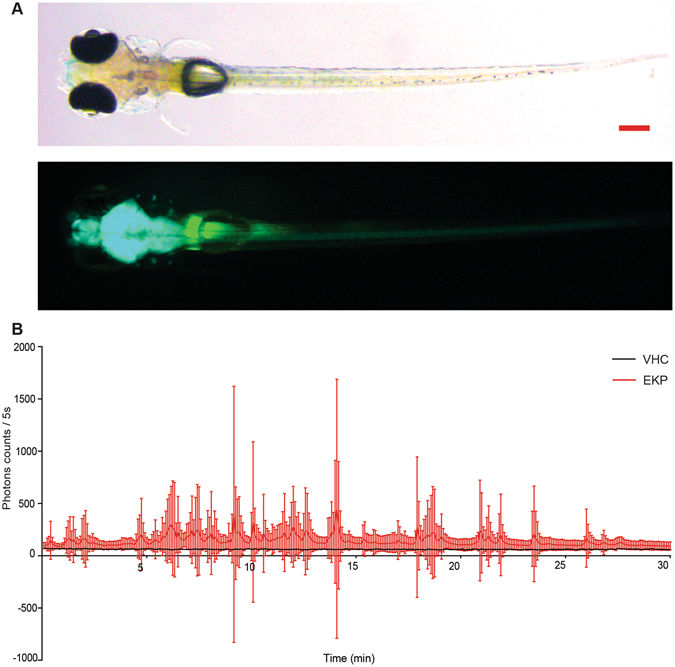
Fig. 4
Neuroluminescence recording of Tg(elavl3:GA) zebrafish exposed to EKP. (A) Bright field (upper) and fluorescence (lower) micrographs of 7 dpf Tg(elavl3:GA) larva (scale bar: 0.20 mm) (B) Photon emission of 7 dpf larvae exposed to VHC (black line) or EKP (400 µM) (red line), after a 20 h incubation to CLZN-h (40 µM) exposure during a 30-min recording period. The total photon emission (y-axis) is counted per 5-second (sec) interval (x-axis). Results are expressed as mean ± s.d. of 18 independent experiments. For each experiment a group of three larvae was used.
Figure Data
Acknowledgments
This image is the copyrighted work of the attributed author or publisher, and
ZFIN has permission only to display this image to its users.
Additional permissions should be obtained from the applicable author or publisher of the image.
Full text @ Sci. Rep.