Fig. S5
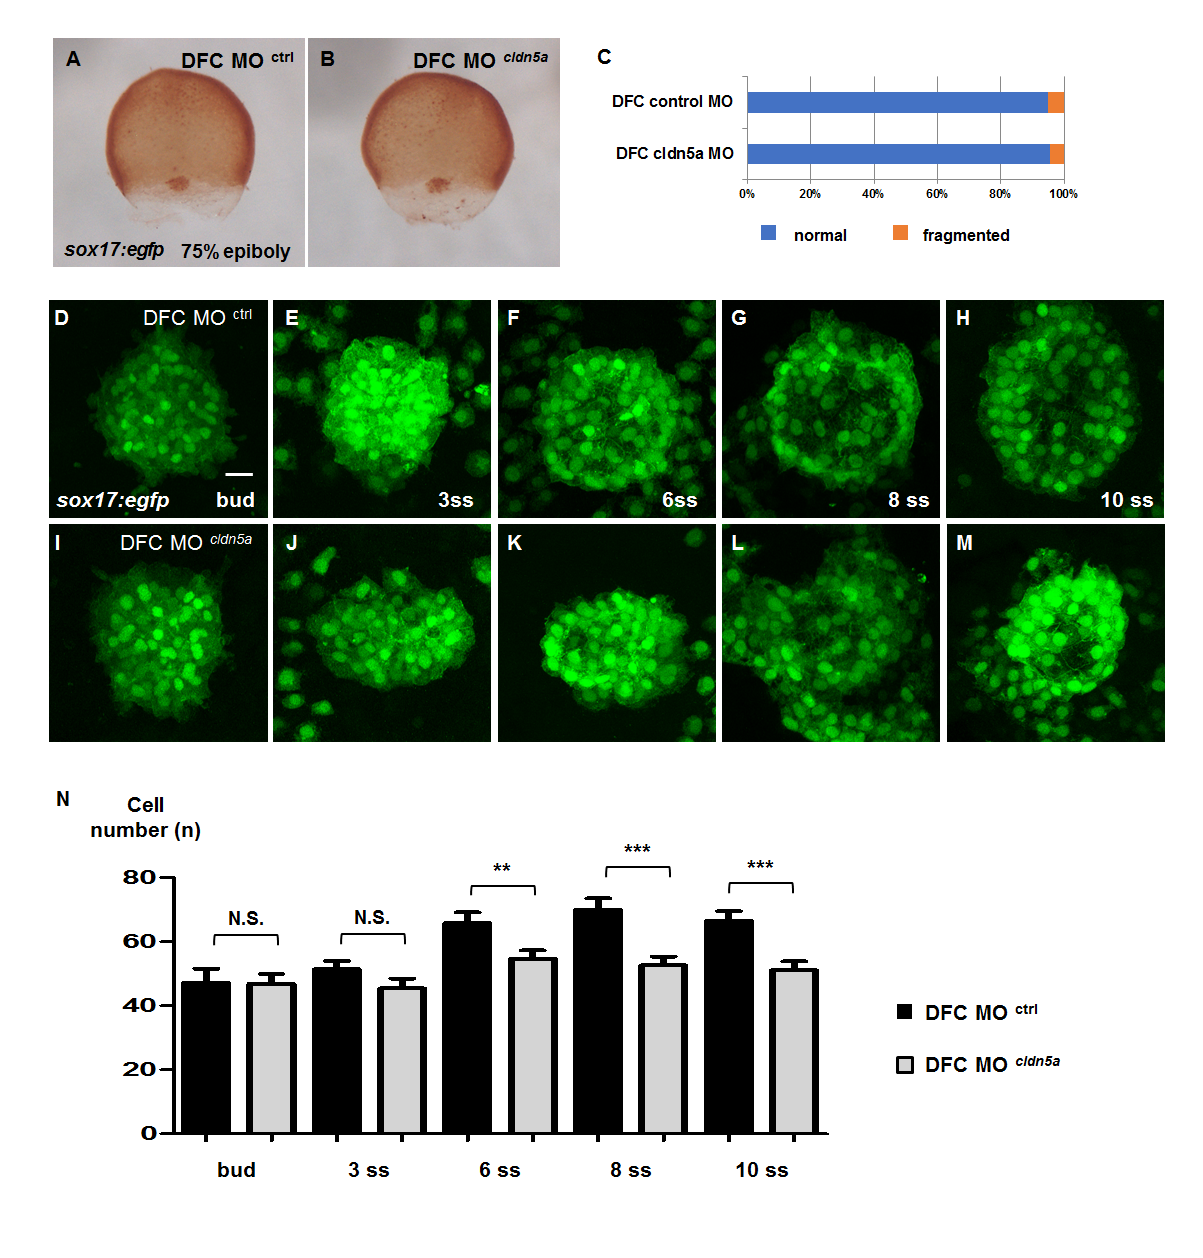
Status of DFC cluster and KV consisting cell number in DFC cldn5a morphants.
(A—B) Visualization of DFCs by immunostaining of sox17-promoter induced EGFP in 75% epiboly embryos. Representative images of DFC control morphants (A) and DFC cldn5a morphants (B). (C) Statistical stacked bar graph (blue; normal, orange; fragmented, DFC control morphants; n = 22, DFC cldn5a morphants; n = 38). (D—M) Maximum intensity projection images of sox17:egfp-positive KV lineage cells in DFC control and cldn5a morphants from bud to 10 ss. (D—H) Representative images of the DFC control morphants. (I—M) Representative images of the DFC cldn5a morphants. (N) Statistical column bar graph (DFC control morphants at bud; n = 18, DFC cldn5a morphants at bud; n = 18, DFC control morphants at 3 ss; n = 25, DFC cldn5a morphants at 3 ss; n = 30, DFC control morphants at 6 ss; n = 23, DFC cldn5a morphants at 6 ss; n = 31, DFC control morphants at 8 ss; n = 19, DFC cldn5a morphants at 8 ss; n = 20, DFC control morphants at 10 ss; n = 16, DFC cldn5a morphants at 10 ss; n = 19). *** depicts p < 0.001, ** depicts p < 0.01, N.S. depicts p > 0.05. Error bars indicate s.e.m. Scale bar: 20 μm.

