
|
Fig. 4
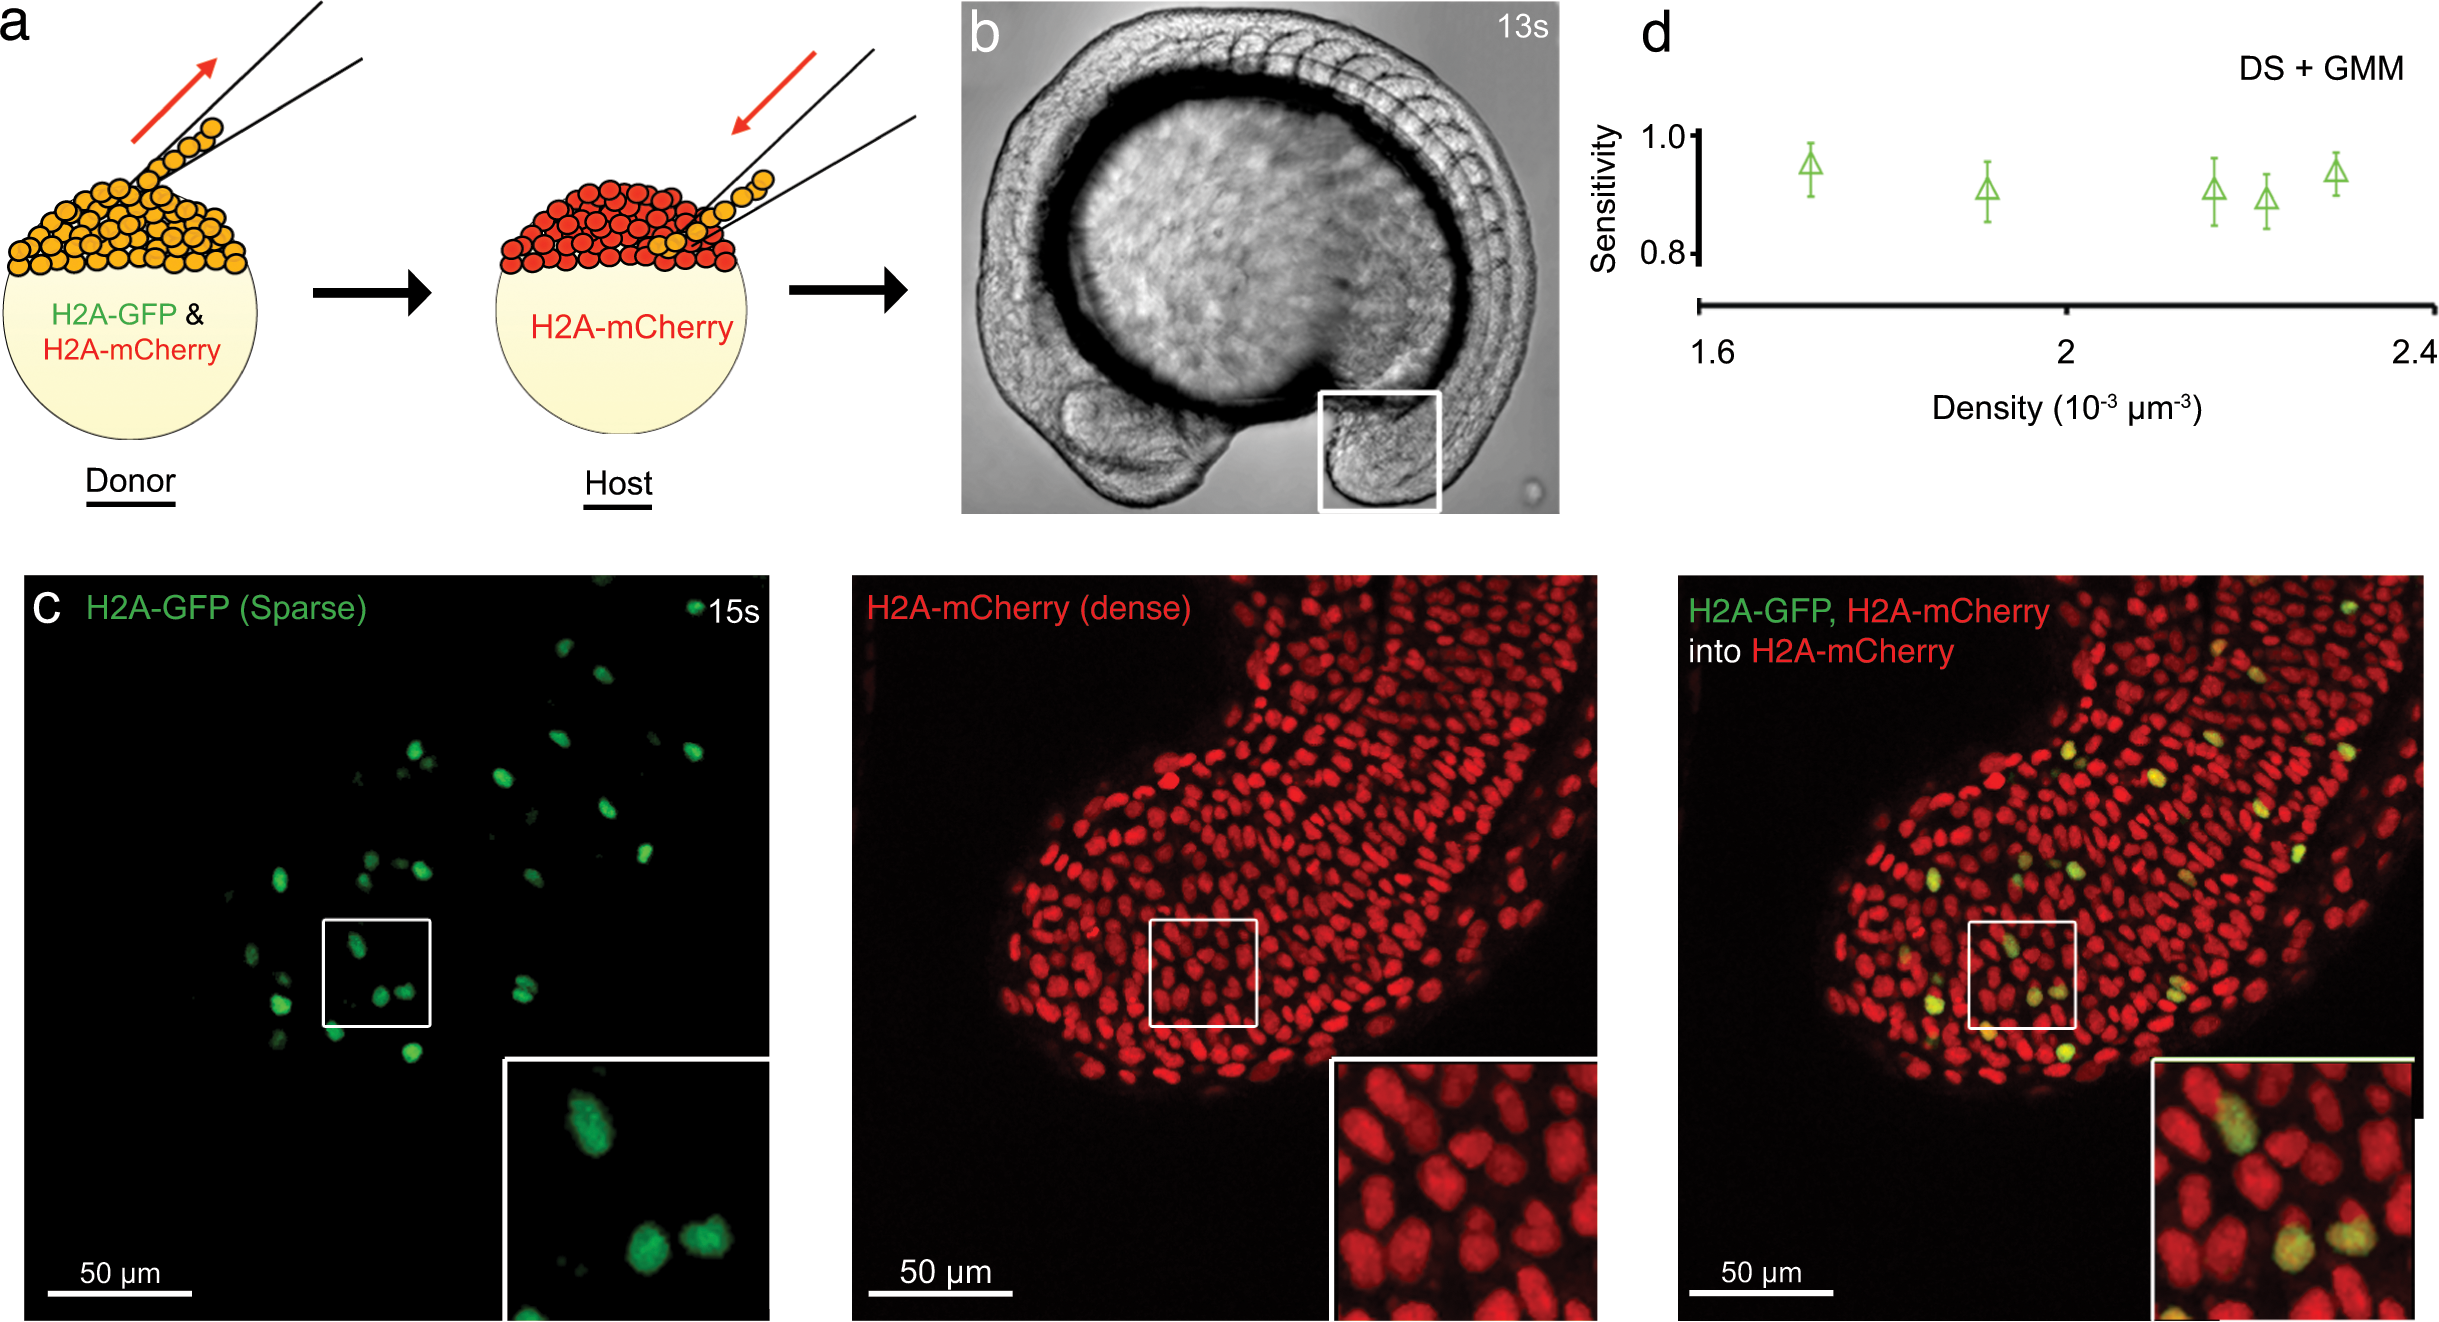
Assessment of 3D segmentation using experimental image data.
(a) Schematic illustration of transplantation experiment. Cells in a donor embryo at blastula stage expressing two histone variants fused to GFP and mCherry (h2Aflv-gfp/ h2Aflv-mCherry) are colored orange. (b) Bright-field image of a 13 somite-stage chimeric embryo. The white box indicates the tailbud. (c) 15 somite-stage chimeric embryo in gfp (left) and mcherry (middle) channels, and merged (right). White box in each image indicates the cropped region (50×50 squared pixels) used for the sensitivity analysis. Inset image is magnification of boxed region. (d) Sensitivity plot over density for five cropped images from four chimeric embryos. Each symbol and error bar indicates the temporal average and standard deviation, respectively, of the sensitivity over 10 time frames for a cropped image. Parameters in DS are α = β = γ = δ = 1, ε = 2, and σg = 1.2. De-noising filters; Gaussian filter (σ = 0.5, window size = 5×5 squared pixels) and median filter (window size = 3×3), Lucy-Richardson deconvolution filter with σ = 0.5, non-linear isotropic diffusion filter (κ = 50, n = 5). Both channels for all five cropped images were processed with same parameter values.