
Fig. 6
- ID
- ZDB-IMAGE-180117-6
- Publication
- Pena et al., 2017 - Pyridoxine-Dependent Epilepsy in Zebrafish Caused by Aldh7a1 Deficiency
- All Figures
- Figures for Pena et al., 2017
|
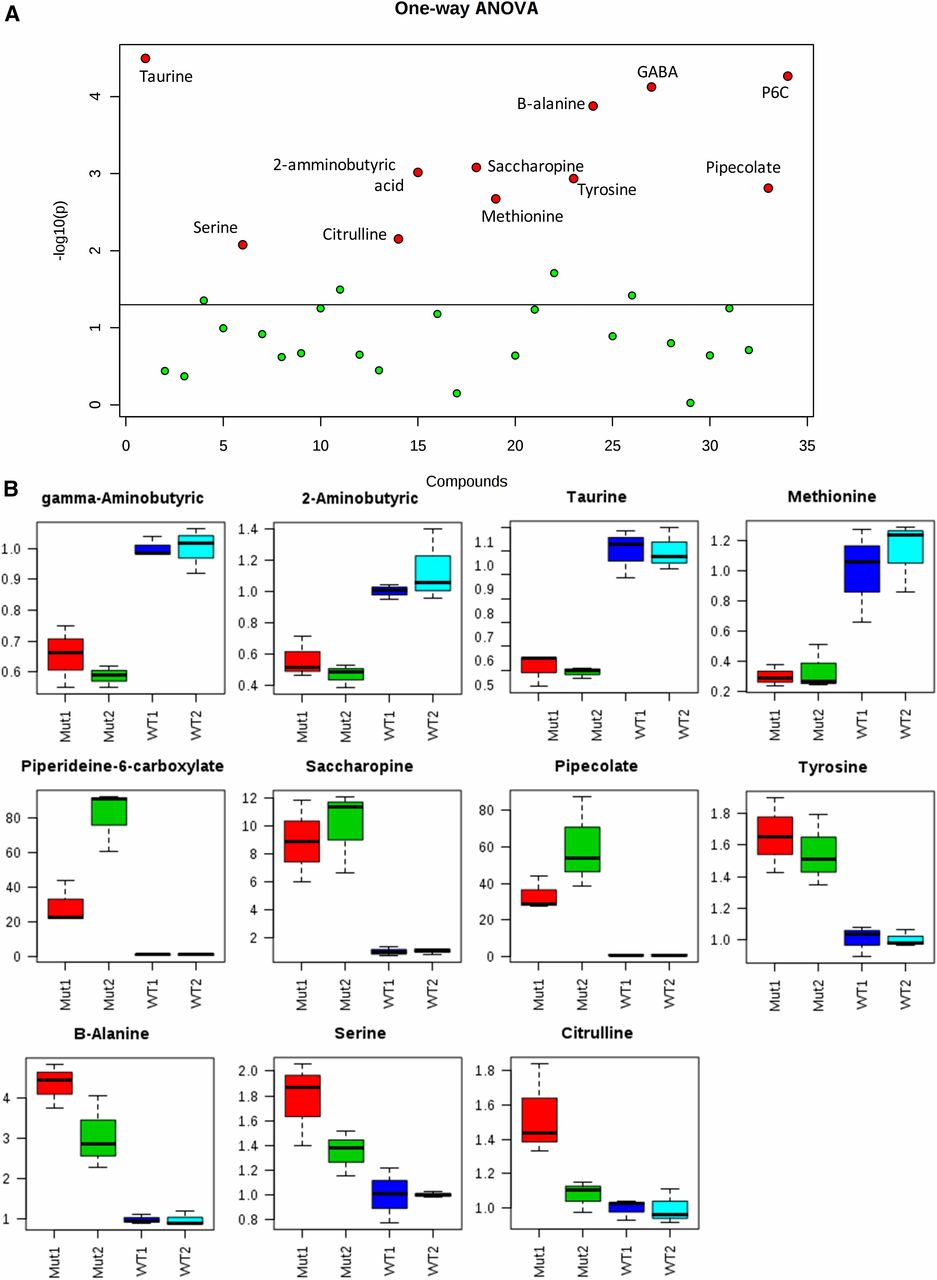
Fig. 6 Targeted mass spectrometry allowed the identification of several amino acid perturbations when comparing two different batches of aldh7a1-null mutants (Mut1 and Mut2) and their WT siblings (WT1 and WT2). (A) Graphical summary of one-way ANOVA analysis comparing the four groups of samples, using P-value cutoff of 0.05. Metabolites identified with statistically significant changes are shown in red and labeled. (B) box and whisker plots summarize the normalized values (mean fold change ± SD) for the metabolites shown in red in (B) significantly different between the two batches of WT and Mut. For this experiment, polar metabolite extracts of three pools (five 11-days postfertilization larvae each) were used for each group. GABA, γ-aminobutyric acid; P6C, piperideine 6-carboxylate; WT, wild-type.