
IMAGE
Fig. S7
- ID
- ZDB-IMAGE-180116-7
- Publication
- Gupta et al., 2017 - Myosin-1 inhibition by PClP affects membrane shape, cortical actin distribution and lipid droplet dynamics in early Zebrafish embryos
- All Figures
- Figures for Gupta et al., 2017
Image
|
Figure Caption
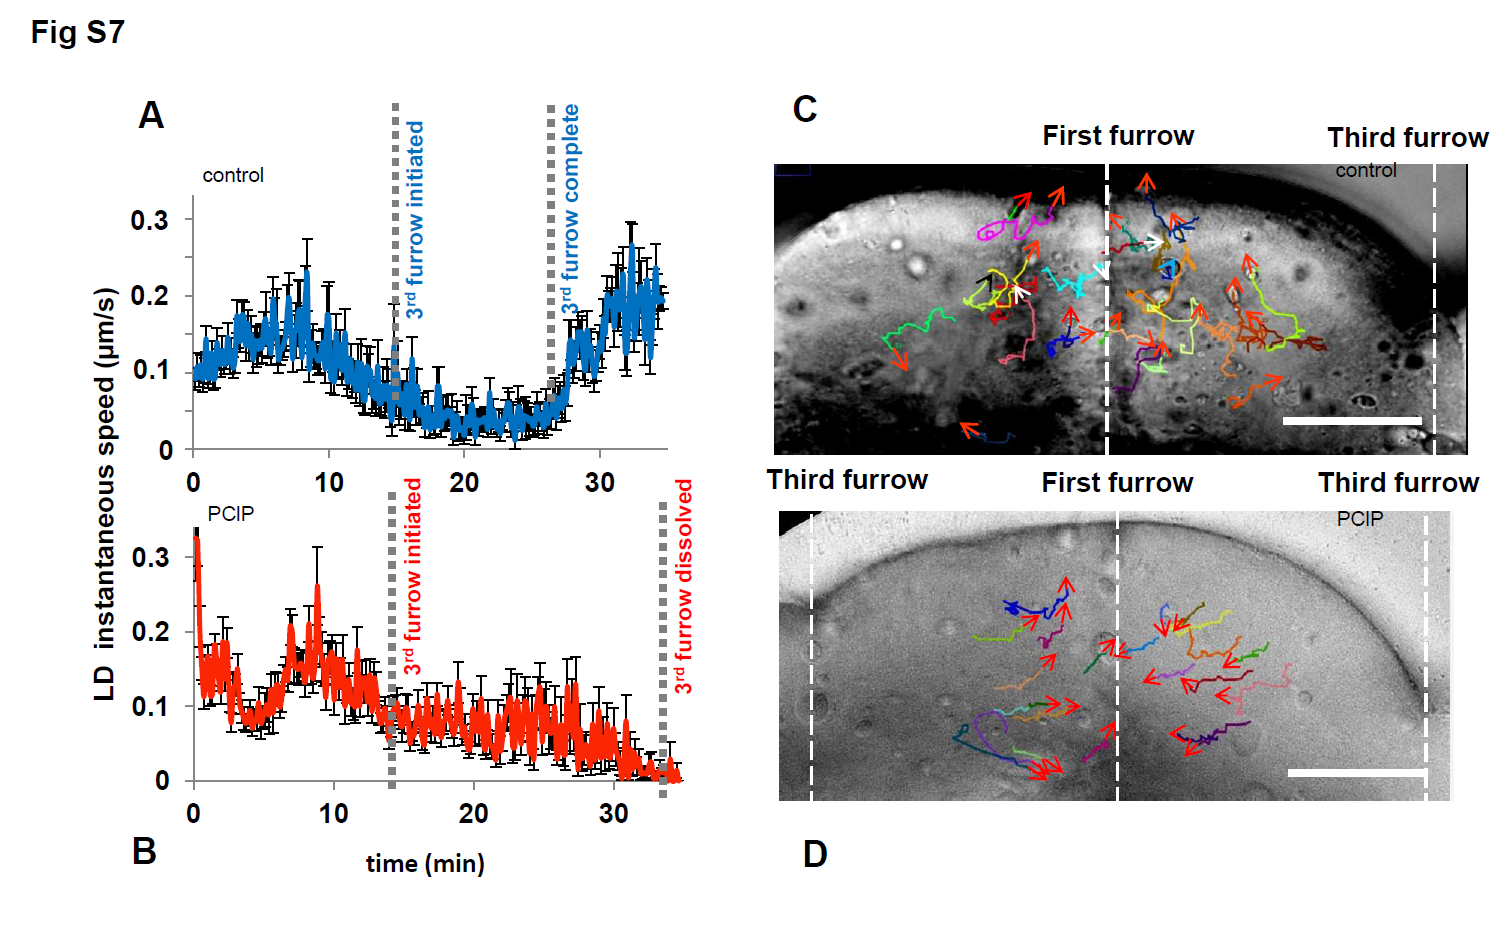
Fig. S7
(A) Average instantaneous speed of LDs in control for 30 min in the dotted region as in S6A Fig, encompassing 3rd furrow formation (B) Average instantaneous speed of LDs in Myo1 inhibited embryo for 30 min in the same region, encompassing 3rd furrow formation. Average of 180 LDs taken from data sets of S5 and S6 Movies, error bars- standard-error. (C) Control (arrows) and (D) Myo1 inhibited (arrows) LD tracks of S5 Movie and A&B panels above, 0–10 mins, vertical lines indicate cleavage furrows, bar 50μm.
Acknowledgments
This image is the copyrighted work of the attributed author or publisher, and
ZFIN has permission only to display this image to its users.
Additional permissions should be obtained from the applicable author or publisher of the image.
Full text @ PLoS One