
Fig. 4
- ID
- ZDB-IMAGE-180116-5
- Publication
- Gupta et al., 2017 - Myosin-1 inhibition by PClP affects membrane shape, cortical actin distribution and lipid droplet dynamics in early Zebrafish embryos
- All Figures
- Figures for Gupta et al., 2017
|
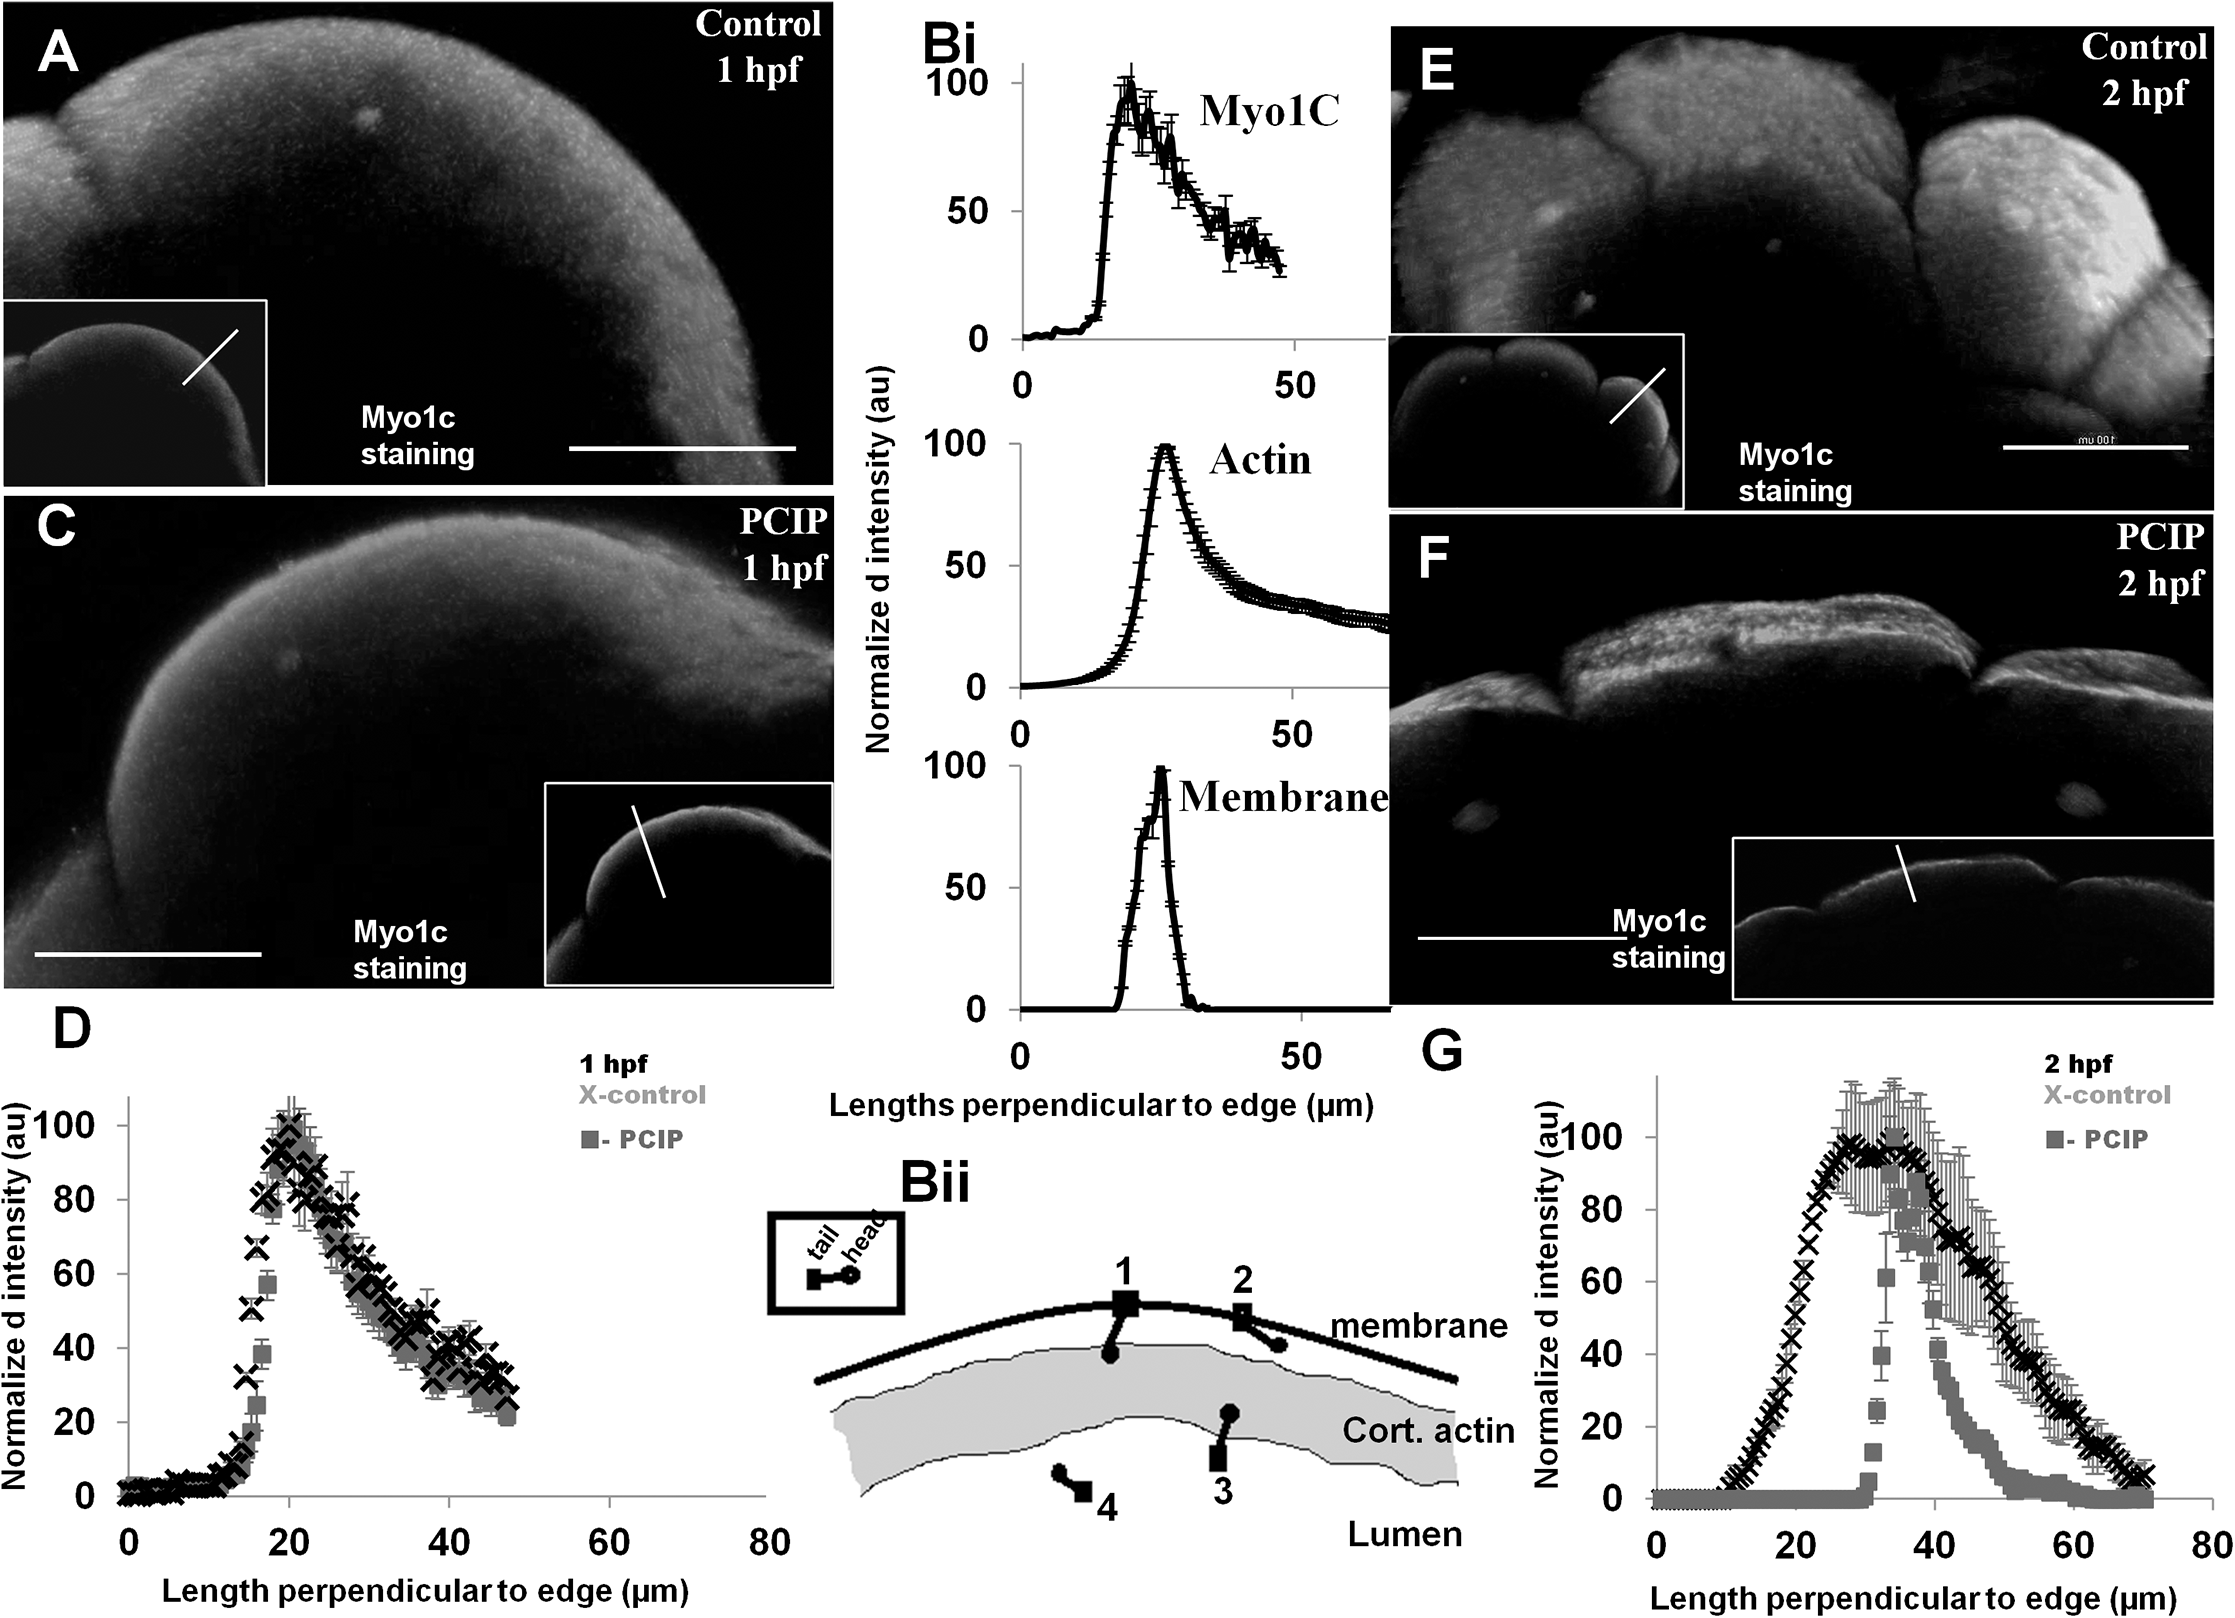
Fig. 4
Redistribution of blastomeric Myo1C upon MyoI inhibition by PClP.
(A) 3D rendered 100 μm cross section of Myo1C immunostaining profile in control 1 hpf embryo (inset- single confocal slice) (Bi) Normalized immunostaining intensity along the line drawn in Fig 4A inset, n = 5 embryos (Bi, top panel). Actin distribution at the same time, redrawn from Fig 3A, left panel, n = 5 (Bi, middle panel). Membrane distribution profile perpendicular to surface of embryo shown in Fig 3D, control)\, (Bi, bottom panel). (Bii) cartoon representation of Myo1C distribution in blastodisc cortex. (C) 3D rendered in 100 μm cross section of Myo1C immunostaining profile in 30 min PClP treated 1 hpf embryo, inset single confocal slice. (D) Comparative normalized intensity calculated long lines drawn in insets of (A&C)-slice views, control-cross, Myo1 inhibited-box, n = 5,. (E) Myo1C profiles for control 2 hpf, (F) Myo1 inhibited 2 hpf and (G) Normalized immunostaining intensity long lines drawn in insets of (E&F)-slice views, control (cross), Myo1 inhibited (box), n = 5, error bar indicates -standard deviation everywhere in Fig 4.