
IMAGE
Fig. S1
- ID
- ZDB-IMAGE-180116-12
- Publication
- Gupta et al., 2017 - Myosin-1 inhibition by PClP affects membrane shape, cortical actin distribution and lipid droplet dynamics in early Zebrafish embryos
- All Figures
- Figures for Gupta et al., 2017
Image
|
Figure Caption
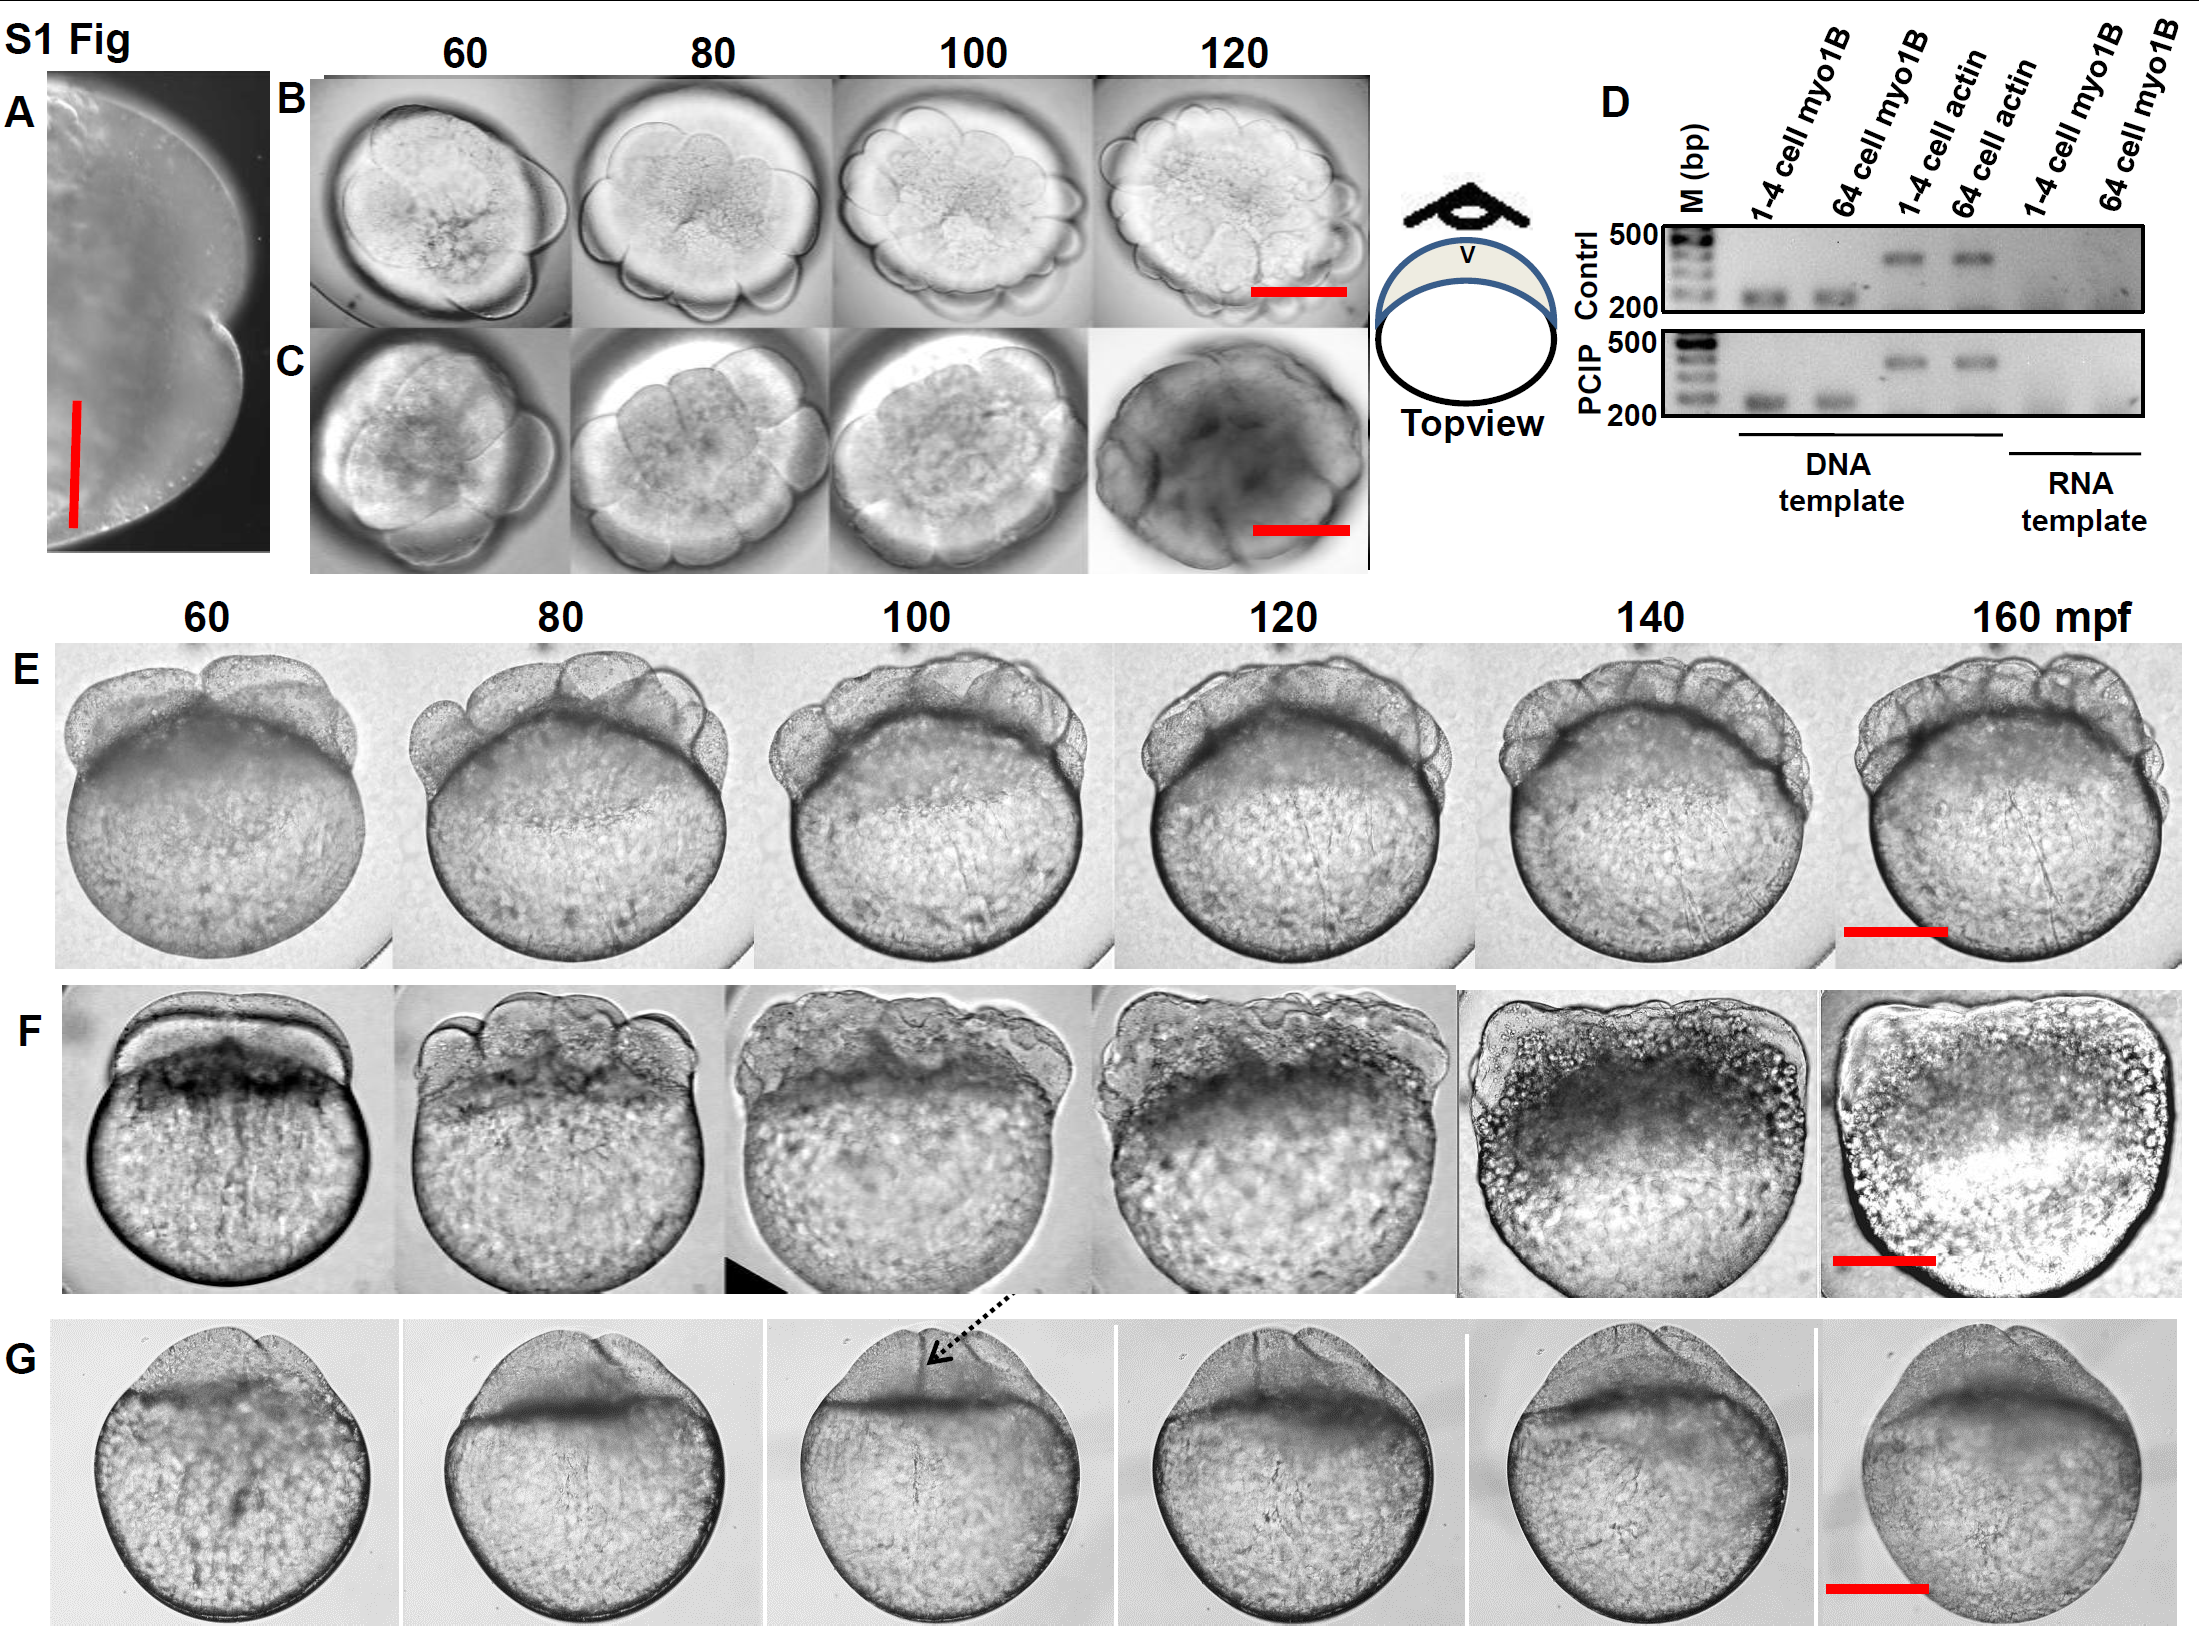
Fig. S1
(A) Example of a two cell stage embryo, where drug was added. (B-C) Difference in cell division arrest phenotype, top-view position for (B) control by (C) 2.5 μM PClP. (D-F) Difference in cell division arrest phenotype, lateral view, extended time for (D) control by (E) 100μM blebbistatin and (F) 2.5 μM PClP. Bar 100 uM.
Acknowledgments
This image is the copyrighted work of the attributed author or publisher, and
ZFIN has permission only to display this image to its users.
Additional permissions should be obtained from the applicable author or publisher of the image.
Full text @ PLoS One