
IMAGE
Fig. S3
- ID
- ZDB-IMAGE-180116-10
- Publication
- Gupta et al., 2017 - Myosin-1 inhibition by PClP affects membrane shape, cortical actin distribution and lipid droplet dynamics in early Zebrafish embryos
- All Figures
- Figures for Gupta et al., 2017
Image
|
Figure Caption
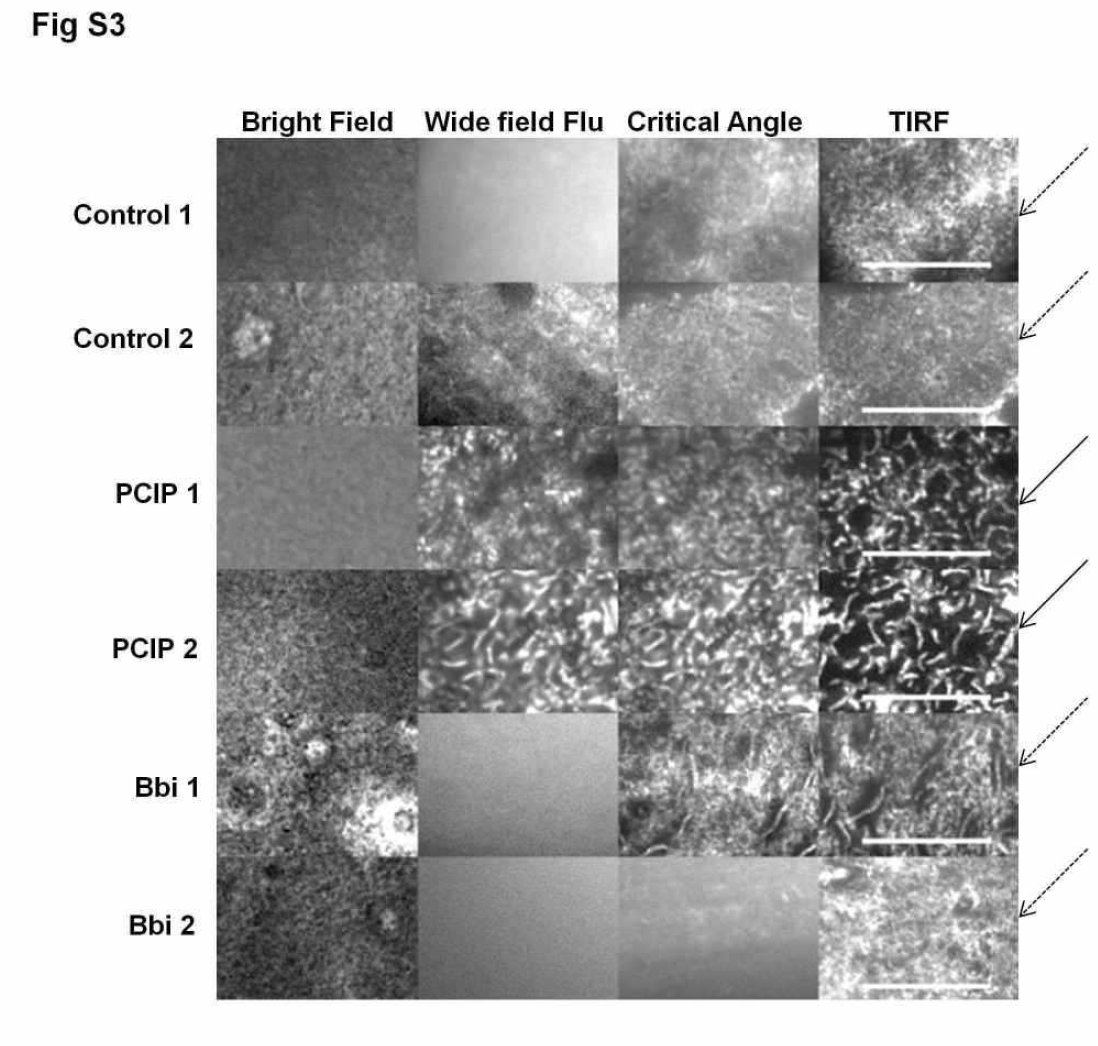
Fig. S3
Cortical actin profile by TIRF of two embryos each, for control, PClP/Myo1 inhibition and blebbistatin treatment/Myo2 inhibition (at 1 hpf/30min treatment for either drug).
Actin appears mainly as dense sheet like structure in control and Myo2 inhibited treated embryos, but appeared tubular in Myo1 inhibited embryos (arrows). (bar 5 μm).
Acknowledgments
This image is the copyrighted work of the attributed author or publisher, and
ZFIN has permission only to display this image to its users.
Additional permissions should be obtained from the applicable author or publisher of the image.
Full text @ PLoS One