
|
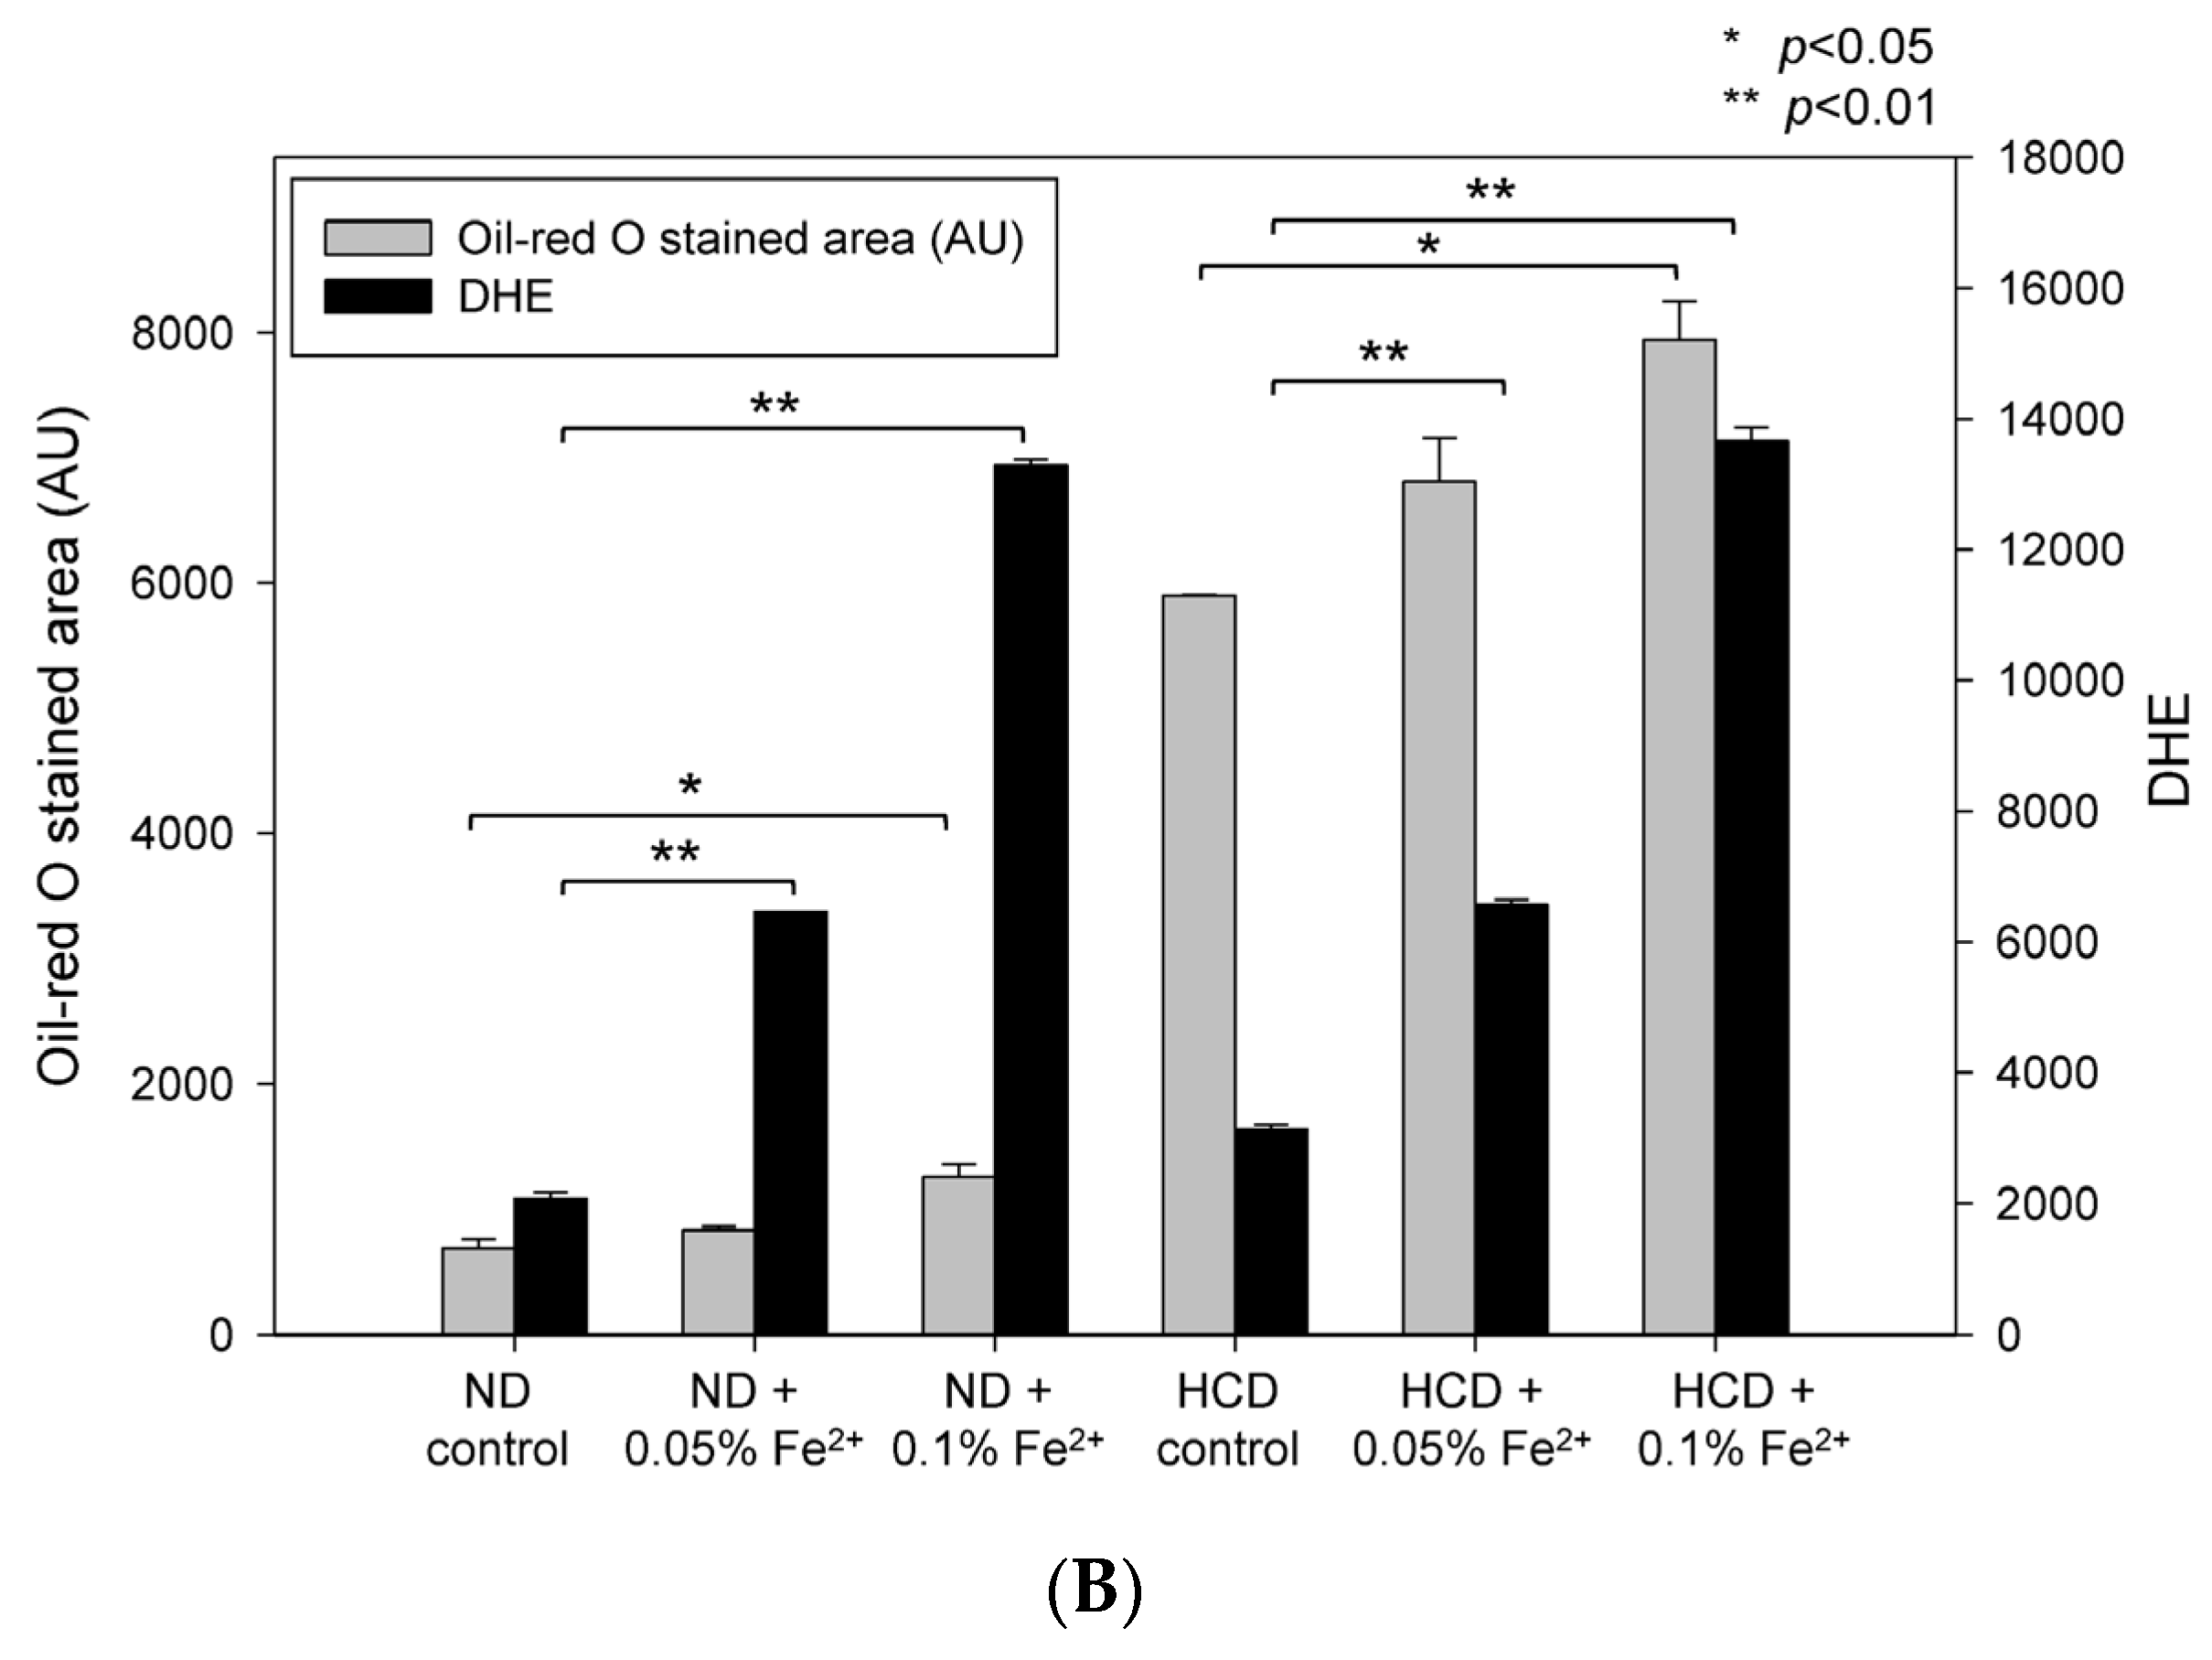
Fig. 7
Histological analysis of hepatic tissue. (A) Representative sections for histological assessment of hepatic microsections after consumption of ferrous ion (0.05% and 0.1% wt/wt in diet) for 24 weeks under normal diet (ND) or high cholesterol diet (HCD). Extent of fatty liver changes was compared by oil red O staining. Production of reactive oxygen species was determined by Dihydroethidium (DHE) staining and visualized by fluorescence (Ex = 588 nm, Em = 615 nm); (B) Quantification of oil red O stained area and DHE stained area by computer-assisted morphometry using Image Proplus software (version 4.5.1.22; Media Cybernetics, Rockville, MD, USA). *, p < 0.05; **, p < 0.01.