
Fig. 3
- ID
- ZDB-IMAGE-180105-46
- Publication
- Smith et al., 2017 - TNFa/TNFR2 signaling is required for glial ensheathment at the dorsal root entry zone
- All Figures
- Figures for Smith et al., 2017
|
Fig. 3
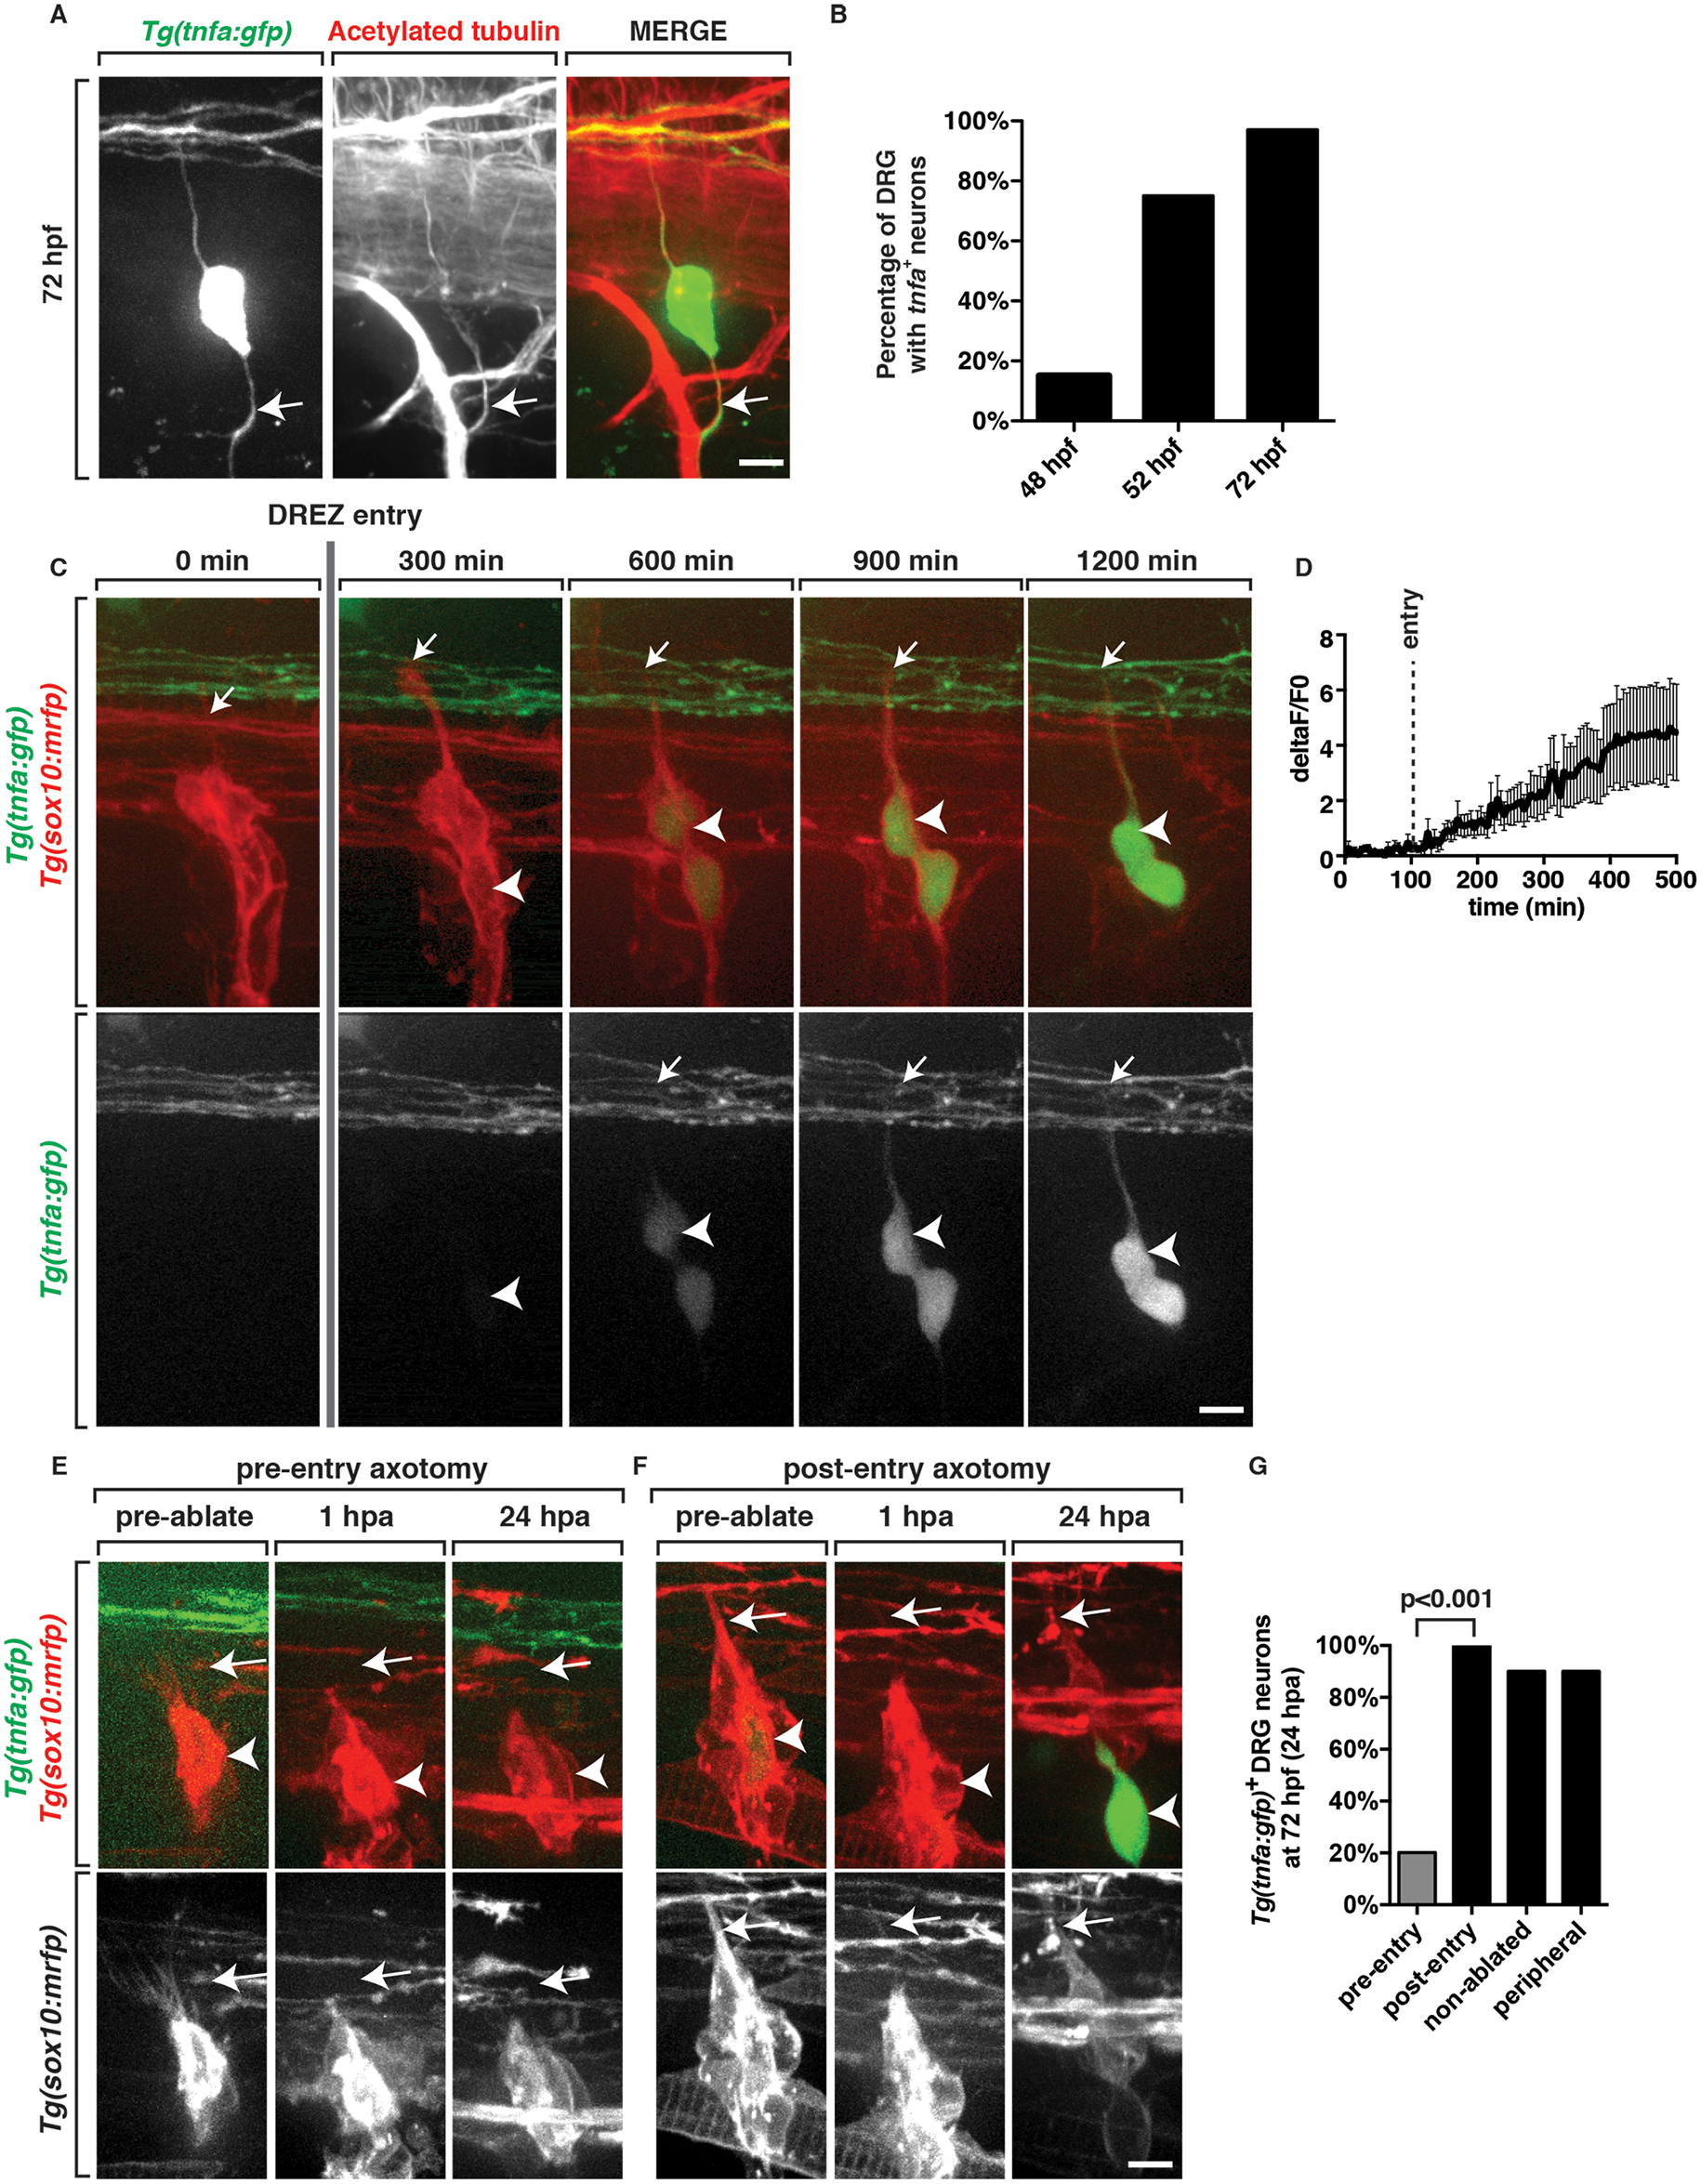
DRG neurons upregulate TNFa after pioneer axons enter the spinal cord.
(A) At 72 hpf, Tg(tnfa:gfp) zebrafish embryos show robust expression of GFP in DRG neurons after the pioneer axon has entered the spinal cord. Arrow demarcates the peripheral projection labeled with acetylated tubulin. (B) Quantification of tnfa+ DRG neurons at 48, 52 and 72 hpf (n = 30 DRG nerves). (C) Excerpt from a 24 hour time-lapse movie starting at 48 hpf in a Tg(tnfa:gfp);Tg(sox10:mrfp) embryo shows GFP expression in DRG neurons increasing as the pioneer axon (arrow), identified by RFP, enters the spinal cord. Arrowhead denotes DRG neuron cell soma. (D) Intensity profile of GFP in movie shown in panel C (n = 7 DRG). (E) Live images of a 48 hpf Tg(tnfa:gfp);Tg(sox10:mrfp) embryo showing a pioneer axon (arrow) just as it has formed pre-axotomy, 1 hpa and 24 hpa. In these images, axotomy prevents pioneer axons from entering the spinal cord and GFP expression is never observed. Arrowhead denotes DRG neuron cell soma. (F) Live images of a 48 hpf Tg(tnfa:gfp);Tg(sox10:mrfp) embryo where the pioneer axon (arrow) had already entered the spinal cord. In this instance, axotomy did not affect GFP expression. (G) Quantification of GFP expression in DRG neurons from panels E and F (n = 5 nerves). Scale bars, 25 μm.