
Fig. S9
- ID
- ZDB-IMAGE-171227-16
- Publication
- Shao et al., 2017 - Vegetally localised Vrtn functions as a novel repressor to modulate bmp2b transcription during dorsoventral patterning in zebrafish.
- All Figures
- Figures for Shao et al., 2017
|
Fig. S9
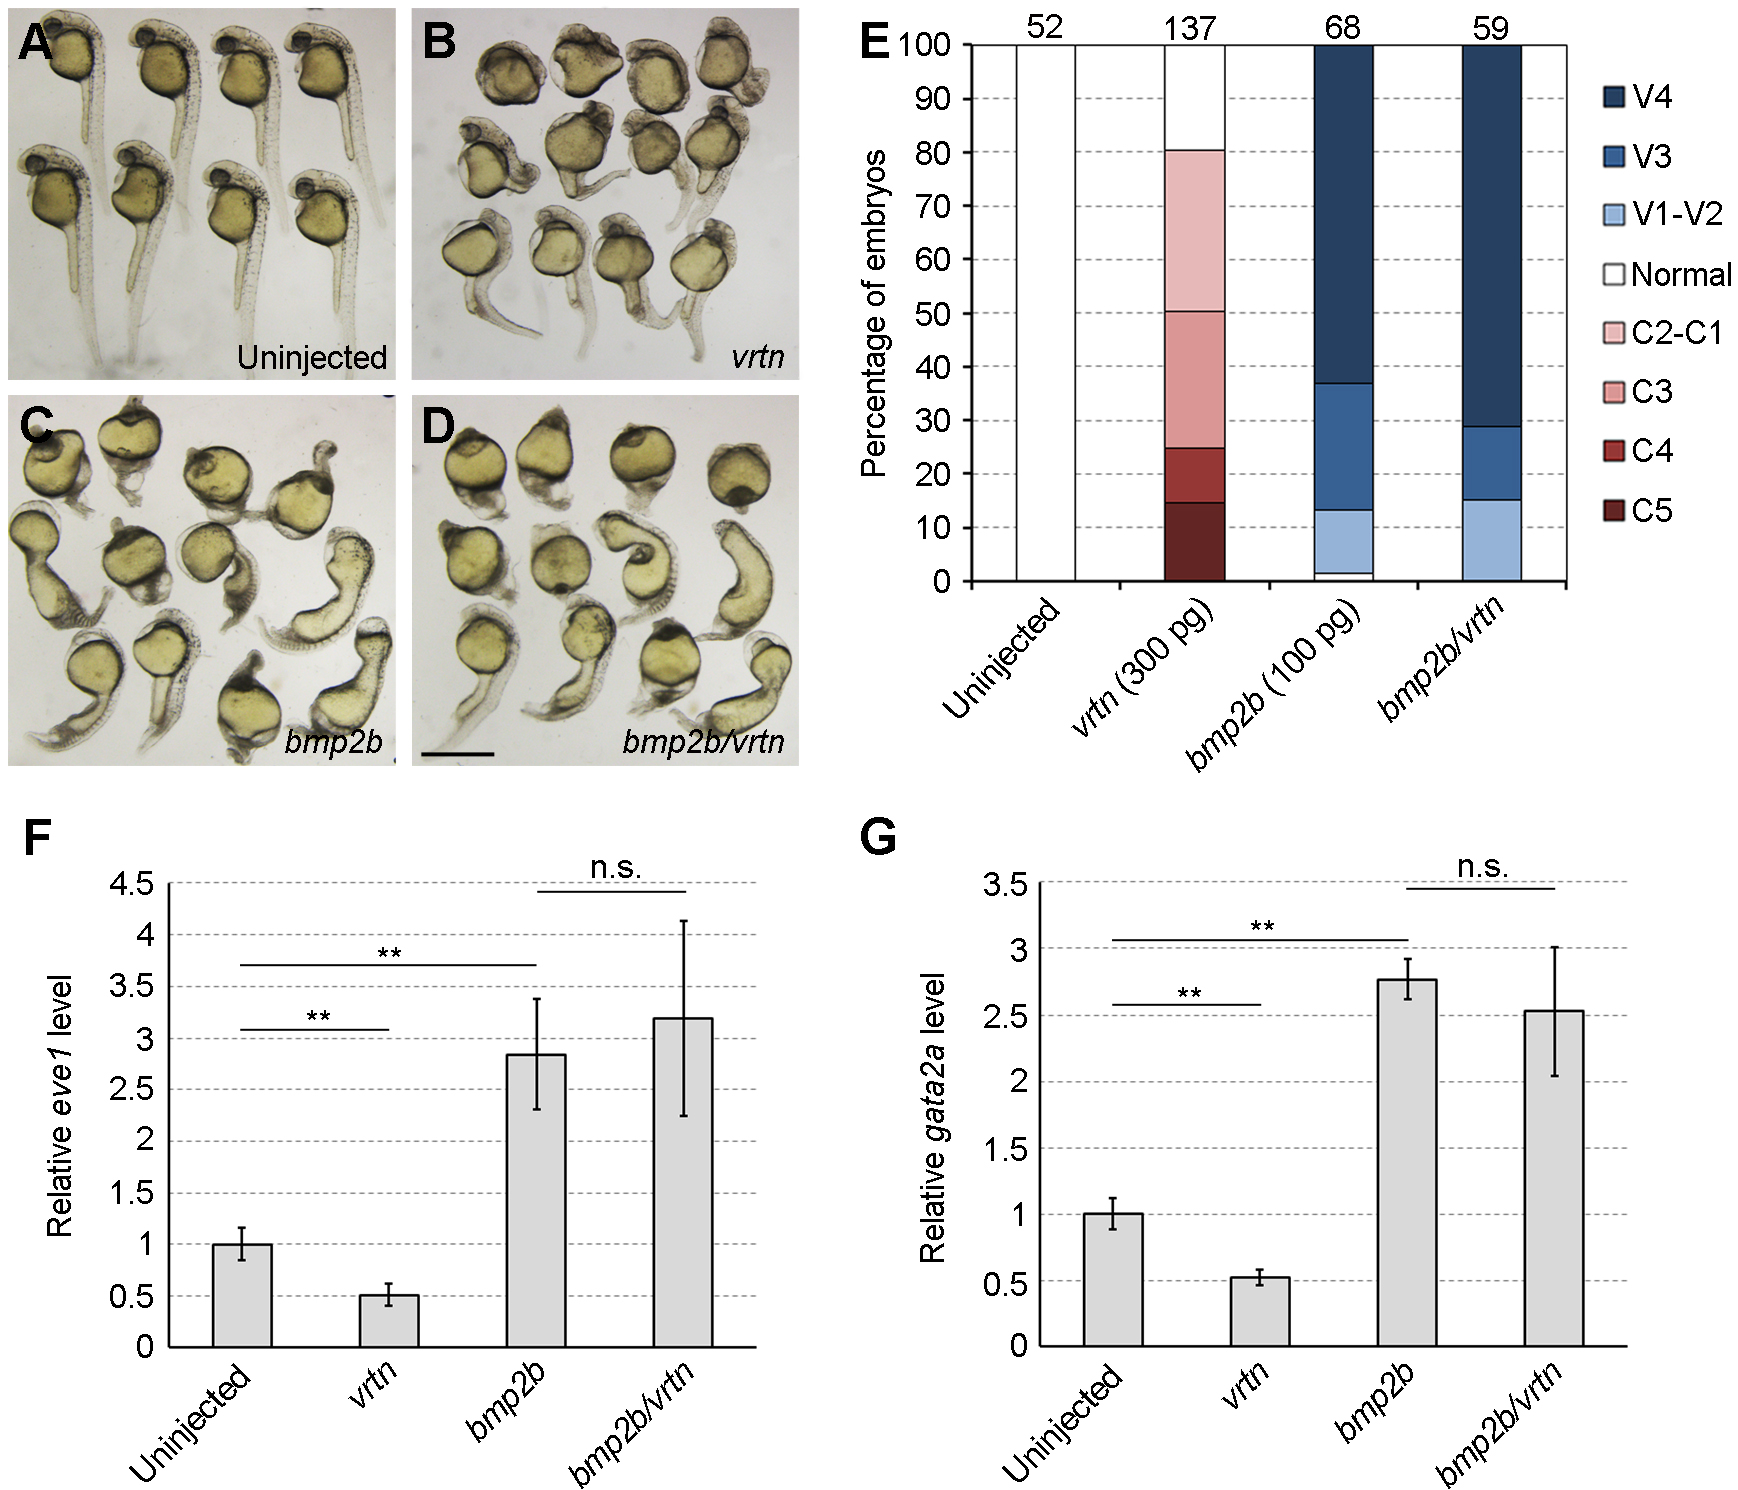
Vrtn does not affect signal transduction by Bmp2b. (A-D) Phenotype analysis of indicated embryos at 28 hpf. The ventralised phenotype resulted from Bmp2b overexpression is not reversed by the presence of Vrtn. (E) Statistical analysis of the phenotypes. Numbers on the top indicate total embryos scored from two independent experiments. (F,G) Analysis by qRT-PCR of eve1 and gata2a expression at 75% epiboly. The relative expression level of eve1 and gata2a in uninjected embryos is normalised as 1, and bars represent the mean values ± s.d. from three independent experiments. Vrtn does not affect eve1 and gata2a expression induced by Bmp2b. Scale bar: 800 μm.