
Fig. 4
- ID
- ZDB-IMAGE-171207-30
- Publication
- Lu et al., 2015 - Direct regulation of p53 by miR-142a-3p mediates the survival of hematopoietic stem and progenitor cells in zebrafish
- All Figures
- Figures for Lu et al., 2015
|
Fig. 4
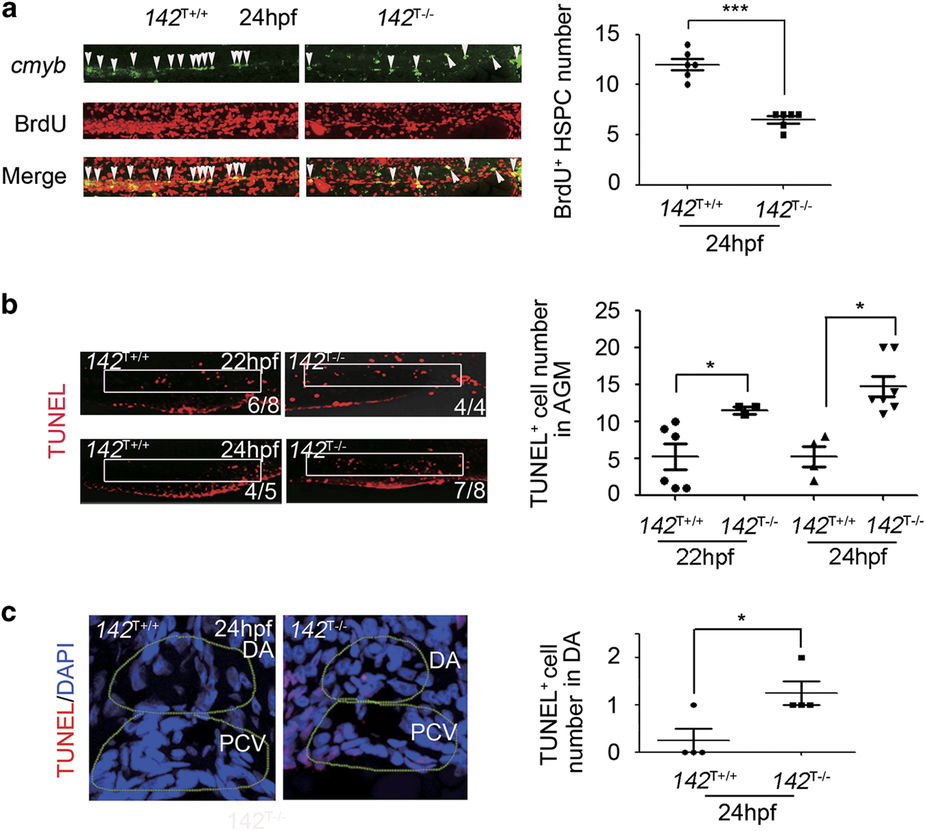
142T−/− embryos display decreased proliferation and increased apoptosis of HSPCs. (a) Percentage of the proliferative HSPCs labeled by BrdU (marked by white arrow heads) in the AGM of 142T−/− embryos and wild-type siblings 24 hpf (mean±s.d., n=6, *P<0.001). (b) TUNEL assay showed more apoptotic cells (white box) in the AGM of 142T−/− embryos at 22 and 24 hpf. The number of TUNEL-positive cells in the AGM region was quantified (mean±s.d., n=3, *P<0.05). (c) Transverse section showed increased apoptotic HSPCs in the AGM region of 142T−/− embryos. Yellow dashed circles denote the dorsal aorta and cardinal vein. TUNEL-positive cells were counted in the dorsal aortal region (mean±s.d., n=4, *P<0.05).