
Fig. 5
- ID
- ZDB-IMAGE-171207-15
- Publication
- Zhao et al., 2015 - Multiplexed 3D FRET imaging in deep tissue of live embryos
- All Figures
- Figures for Zhao et al., 2015
|
Fig. 5
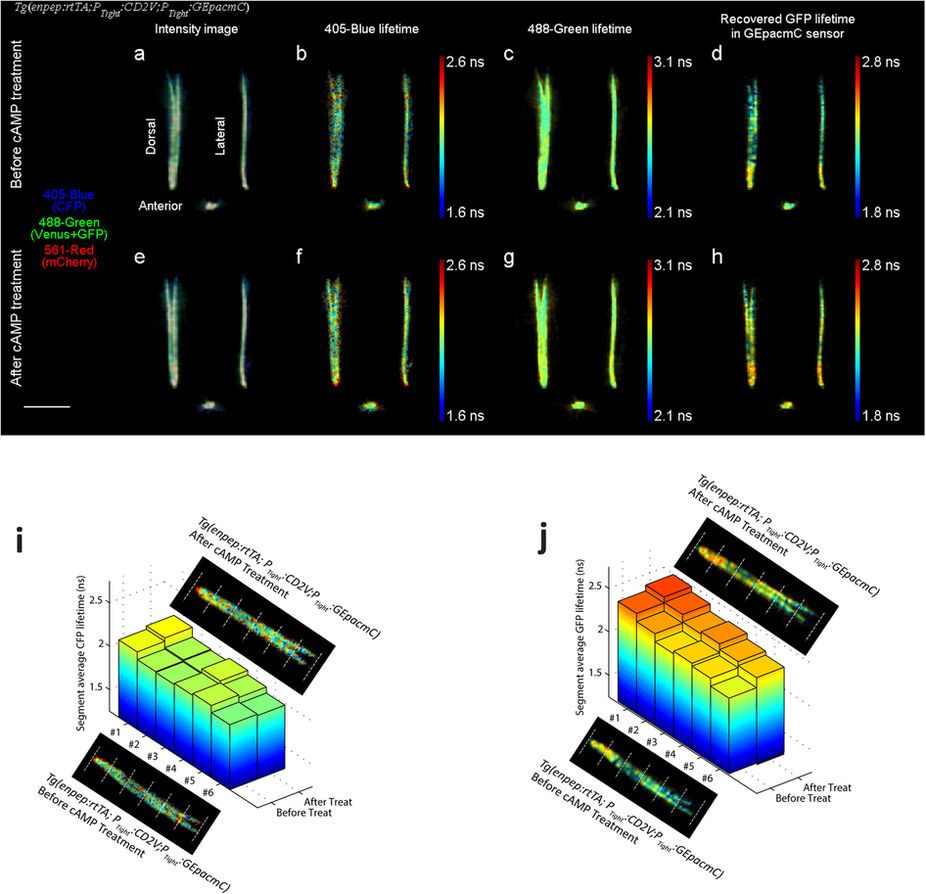
Dorsal, lateral and anterior projections of a 48 hpf Tg(enpep:rtTA; PTight:CD2V;PTight:GEpacmC) zebrafish embryo expressing both CD2V sensor and GEpacmC sensor, before and after being treated with 100 μM forskolin and 400 μM IBMX for 2 hours to increase cellular cAMP level.
(a,e) False color fluorescence intensity projections before and after treatment, with 405-blue channel in blue, 488-green channel in green and 561-red channel in red. (b,f) 405-blue channel fluorescence lifetime (CFP lifetime) remained the same after treatment. (c,g) 488-green channel fluorescence lifetime (intensity weighted average of Venus and GFP lifetimes) was slightly increased by the treatment. (d,h) Recovered GFP lifetime by the triple-channel intensity lifetime analysis. GFP lifetime increased by 0.1 ns after the cAMP treatment. (i) Average CFP lifetimes in 6 segments of the kidney tubule divided equally, before and after the cAMP treatment. CFP lifetimes in different segments showed significant spatial variation, and were not significantly affected by the cAMP treatment. (j) Average recovered GFP lifetimes in 6 tubule segments, before and after the cAMP treatment. Although GFP lifetime had significant segment-to-segment variation, they all exhibited an increase after the cAMP treatment. Scale bar, 500 μm.