
Fig. 3
- ID
- ZDB-IMAGE-171207-13
- Publication
- Zhao et al., 2015 - Multiplexed 3D FRET imaging in deep tissue of live embryos
- All Figures
- Figures for Zhao et al., 2015
|
Fig. 3
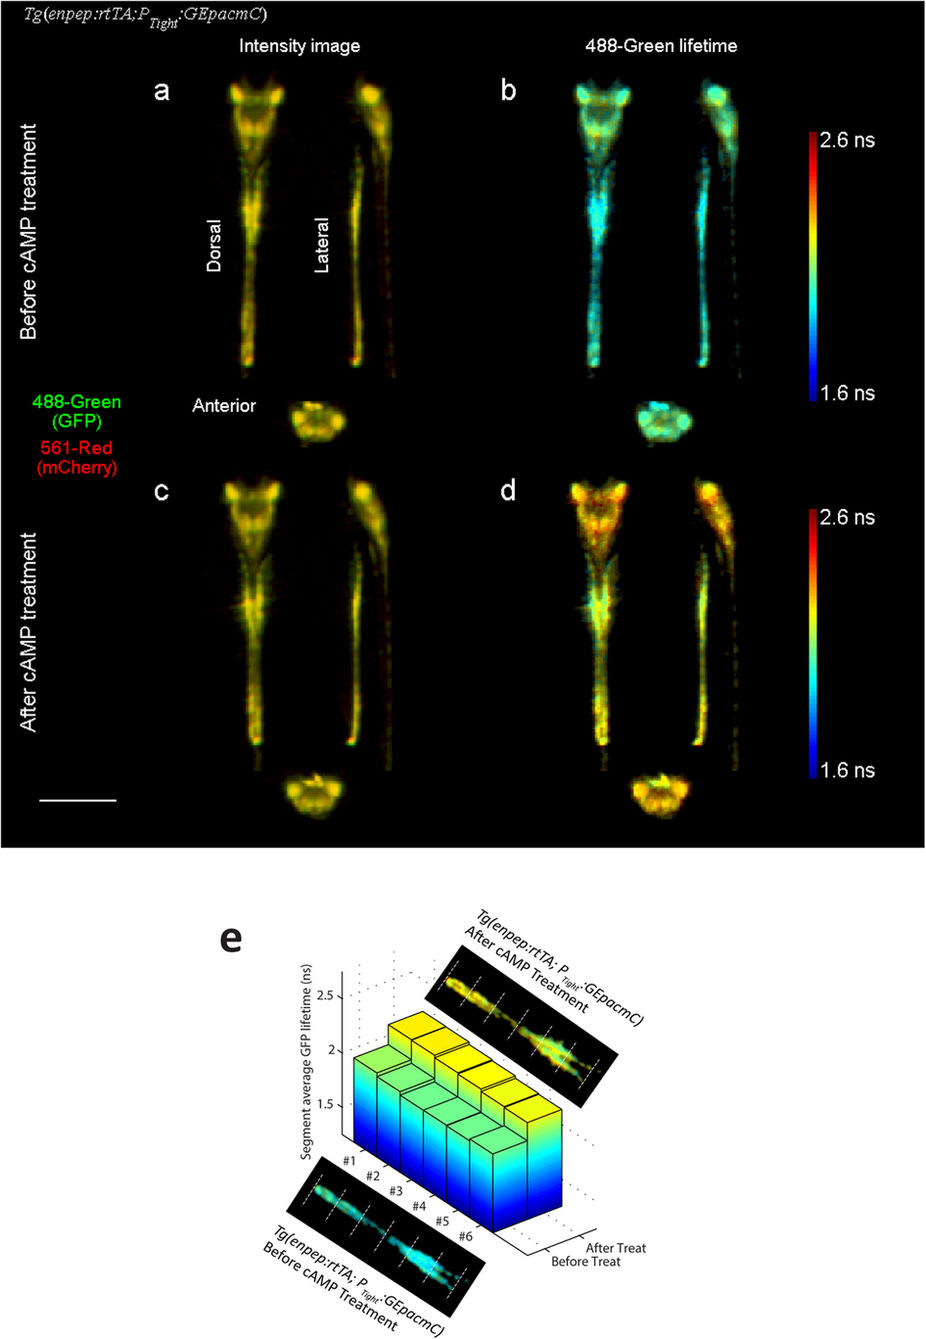
Dorsal, lateral and anterior projections of a 48 hpf Tg(enpep:rtTA; PTight:GEpacmC) zebrafish embryo expressing GEpacmC sensor in kidney tubules and neurons, before and after being treated with 100 μM forskolin and 400 μM IBMX for 2 hours.
(a,c) False color fluorescence intensity projections before and after the treatment, with GFP in green (488-green channel) and mCherry in red (561-red channel). (b,d) GFP lifetime before and after treatment, showing tissue specific variation, which may indicate variations in cAMP level. After the treatment, GFP lifetime increased by 0.2 ns evenly over all tissue types. (e) Average GFP lifetimes in 6 segments of kidney tubules divided equally along the tubule, before and after the cAMP treatment. All segments exhibited GFP lifetime increase after the treatment. Scale bar, 500 μm.