
Fig. 2
- ID
- ZDB-IMAGE-171207-12
- Publication
- Zhao et al., 2015 - Multiplexed 3D FRET imaging in deep tissue of live embryos
- All Figures
- Figures for Zhao et al., 2015
|
Fig. 2
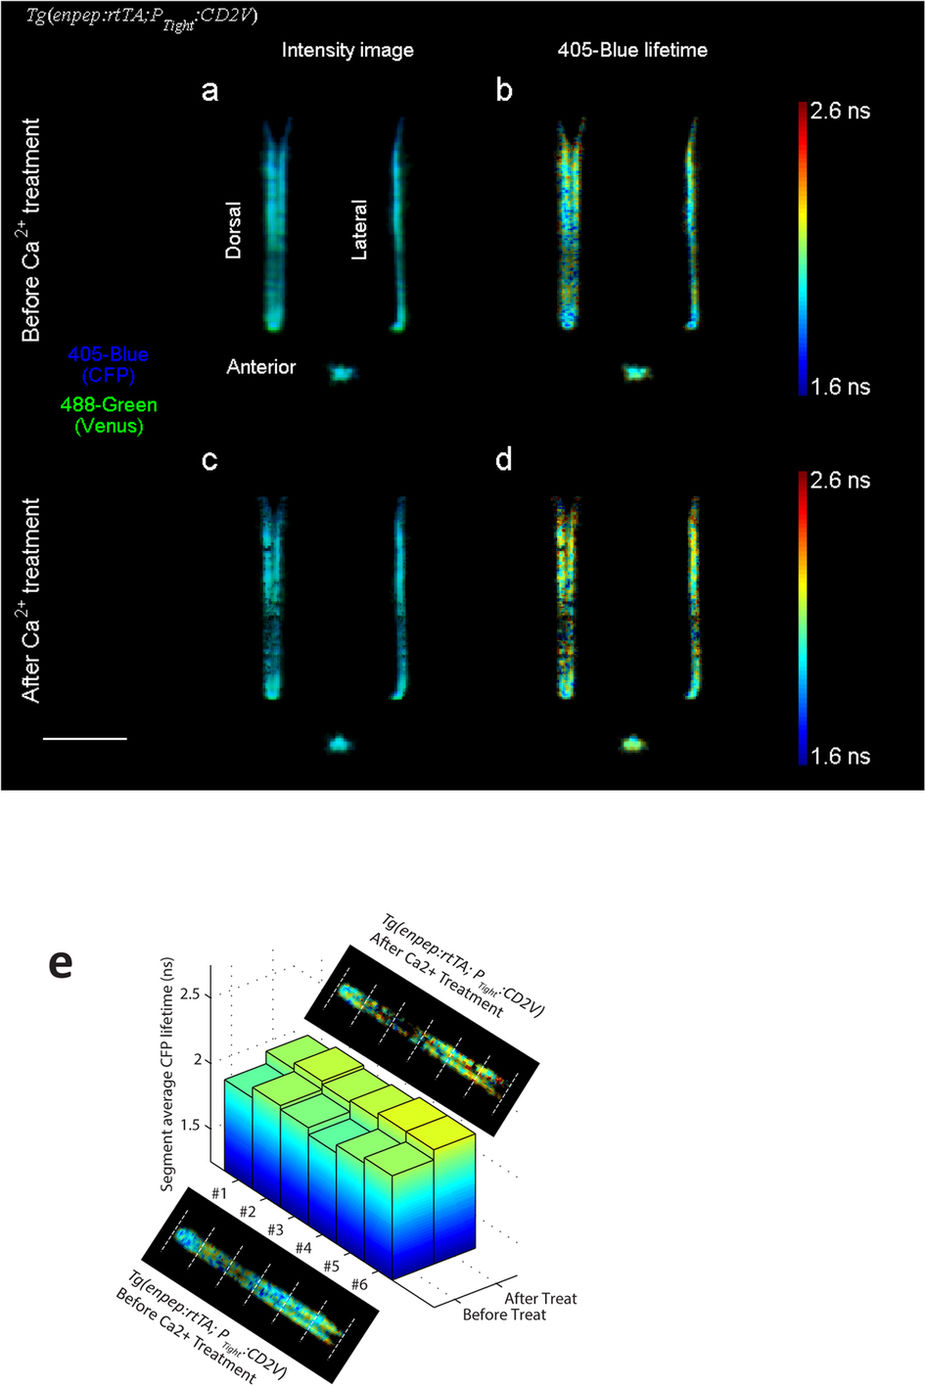
Dorsal, lateral and anterior projections of a 33 hpf Tg(enpep:rtTA; PTight:CD2V) zebrafish embryo expressing CD2V sensor in kidney tubules, before and after being treated with 3 mM EGTA, 100 μM BAPTA-AM and 10 μM ionomycin for 2 hours.
(a,c) False color fluorescence intensity projections before and after the treatment, with CFP in blue (405-blue channel) and Venus in green (488-green channel). (b,d) CFP lifetime varies along the kidney tubule. After the treatment, CFP lifetime increased, on average, by 0.1 ns over the entire kidney tubule. (e) Average CFP lifetimes of 6 segments of kidney tubules divided equally, before and after the Ca2+ treatment. Despite significant variations in average CFP lifetimes between segments, CFP lifetimes in all segments increased after the treatment. Scale bar, 500 μm.