
Fig. 1
- ID
- ZDB-IMAGE-171207-11
- Publication
- Zhao et al., 2015 - Multiplexed 3D FRET imaging in deep tissue of live embryos
- All Figures
- Figures for Zhao et al., 2015
|
Fig. 1
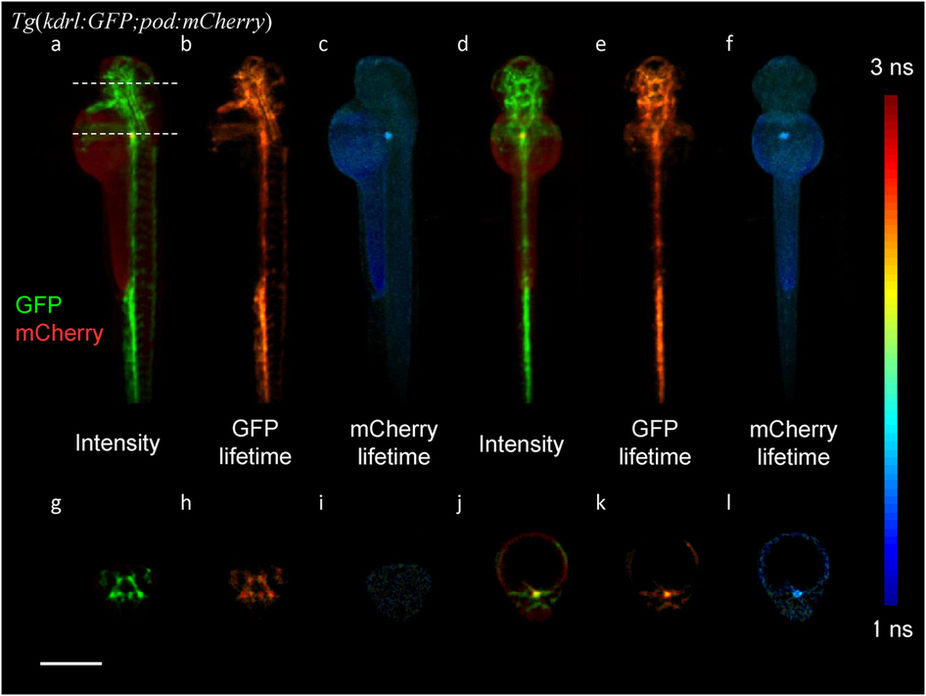
Volumetric fluorescence lifetime images of a Tg (kdrl:GFP;pod:nfsB-mCherry) zebrafish embryo25 at 72 hpf.
(a) Lateral projection of false color fluorescence intensity with GFP in green (488-green channel) and mCherry in red (561-red channel). (b,c) Lateral projection image of false color GFP lifetime and mCherry lifetime. Lifetime was rendered as color according to the color index on the right and intensity was rendered as brightness. (d–f) Dorsal projections of fluorescence intensity, GFP lifetime and mCherry lifetime. (g–i) Cross section fluorescence intensity, GFP lifetime and mCherry lifetime images of the zebrafish head at the upper dotted line marked in (a). (j–l) Cross section fluorescence intensity, GFP lifetime and mCherry lifetime images of the zebrafish kidney at the lower dotted line marked in (a). The color index of all fluorescence lifetime images is shown to the right. Scale bar, 500 μm.