
Fig. 6
- ID
- ZDB-IMAGE-171206-28
- Publication
- Kozlovskaja-Gumbrienė et al., 2017 - Proliferation-independent regulation of organ size by Fgf/Notch signaling
- All Figures
- Figures for Kozlovskaja-Gumbrienė et al., 2017
|
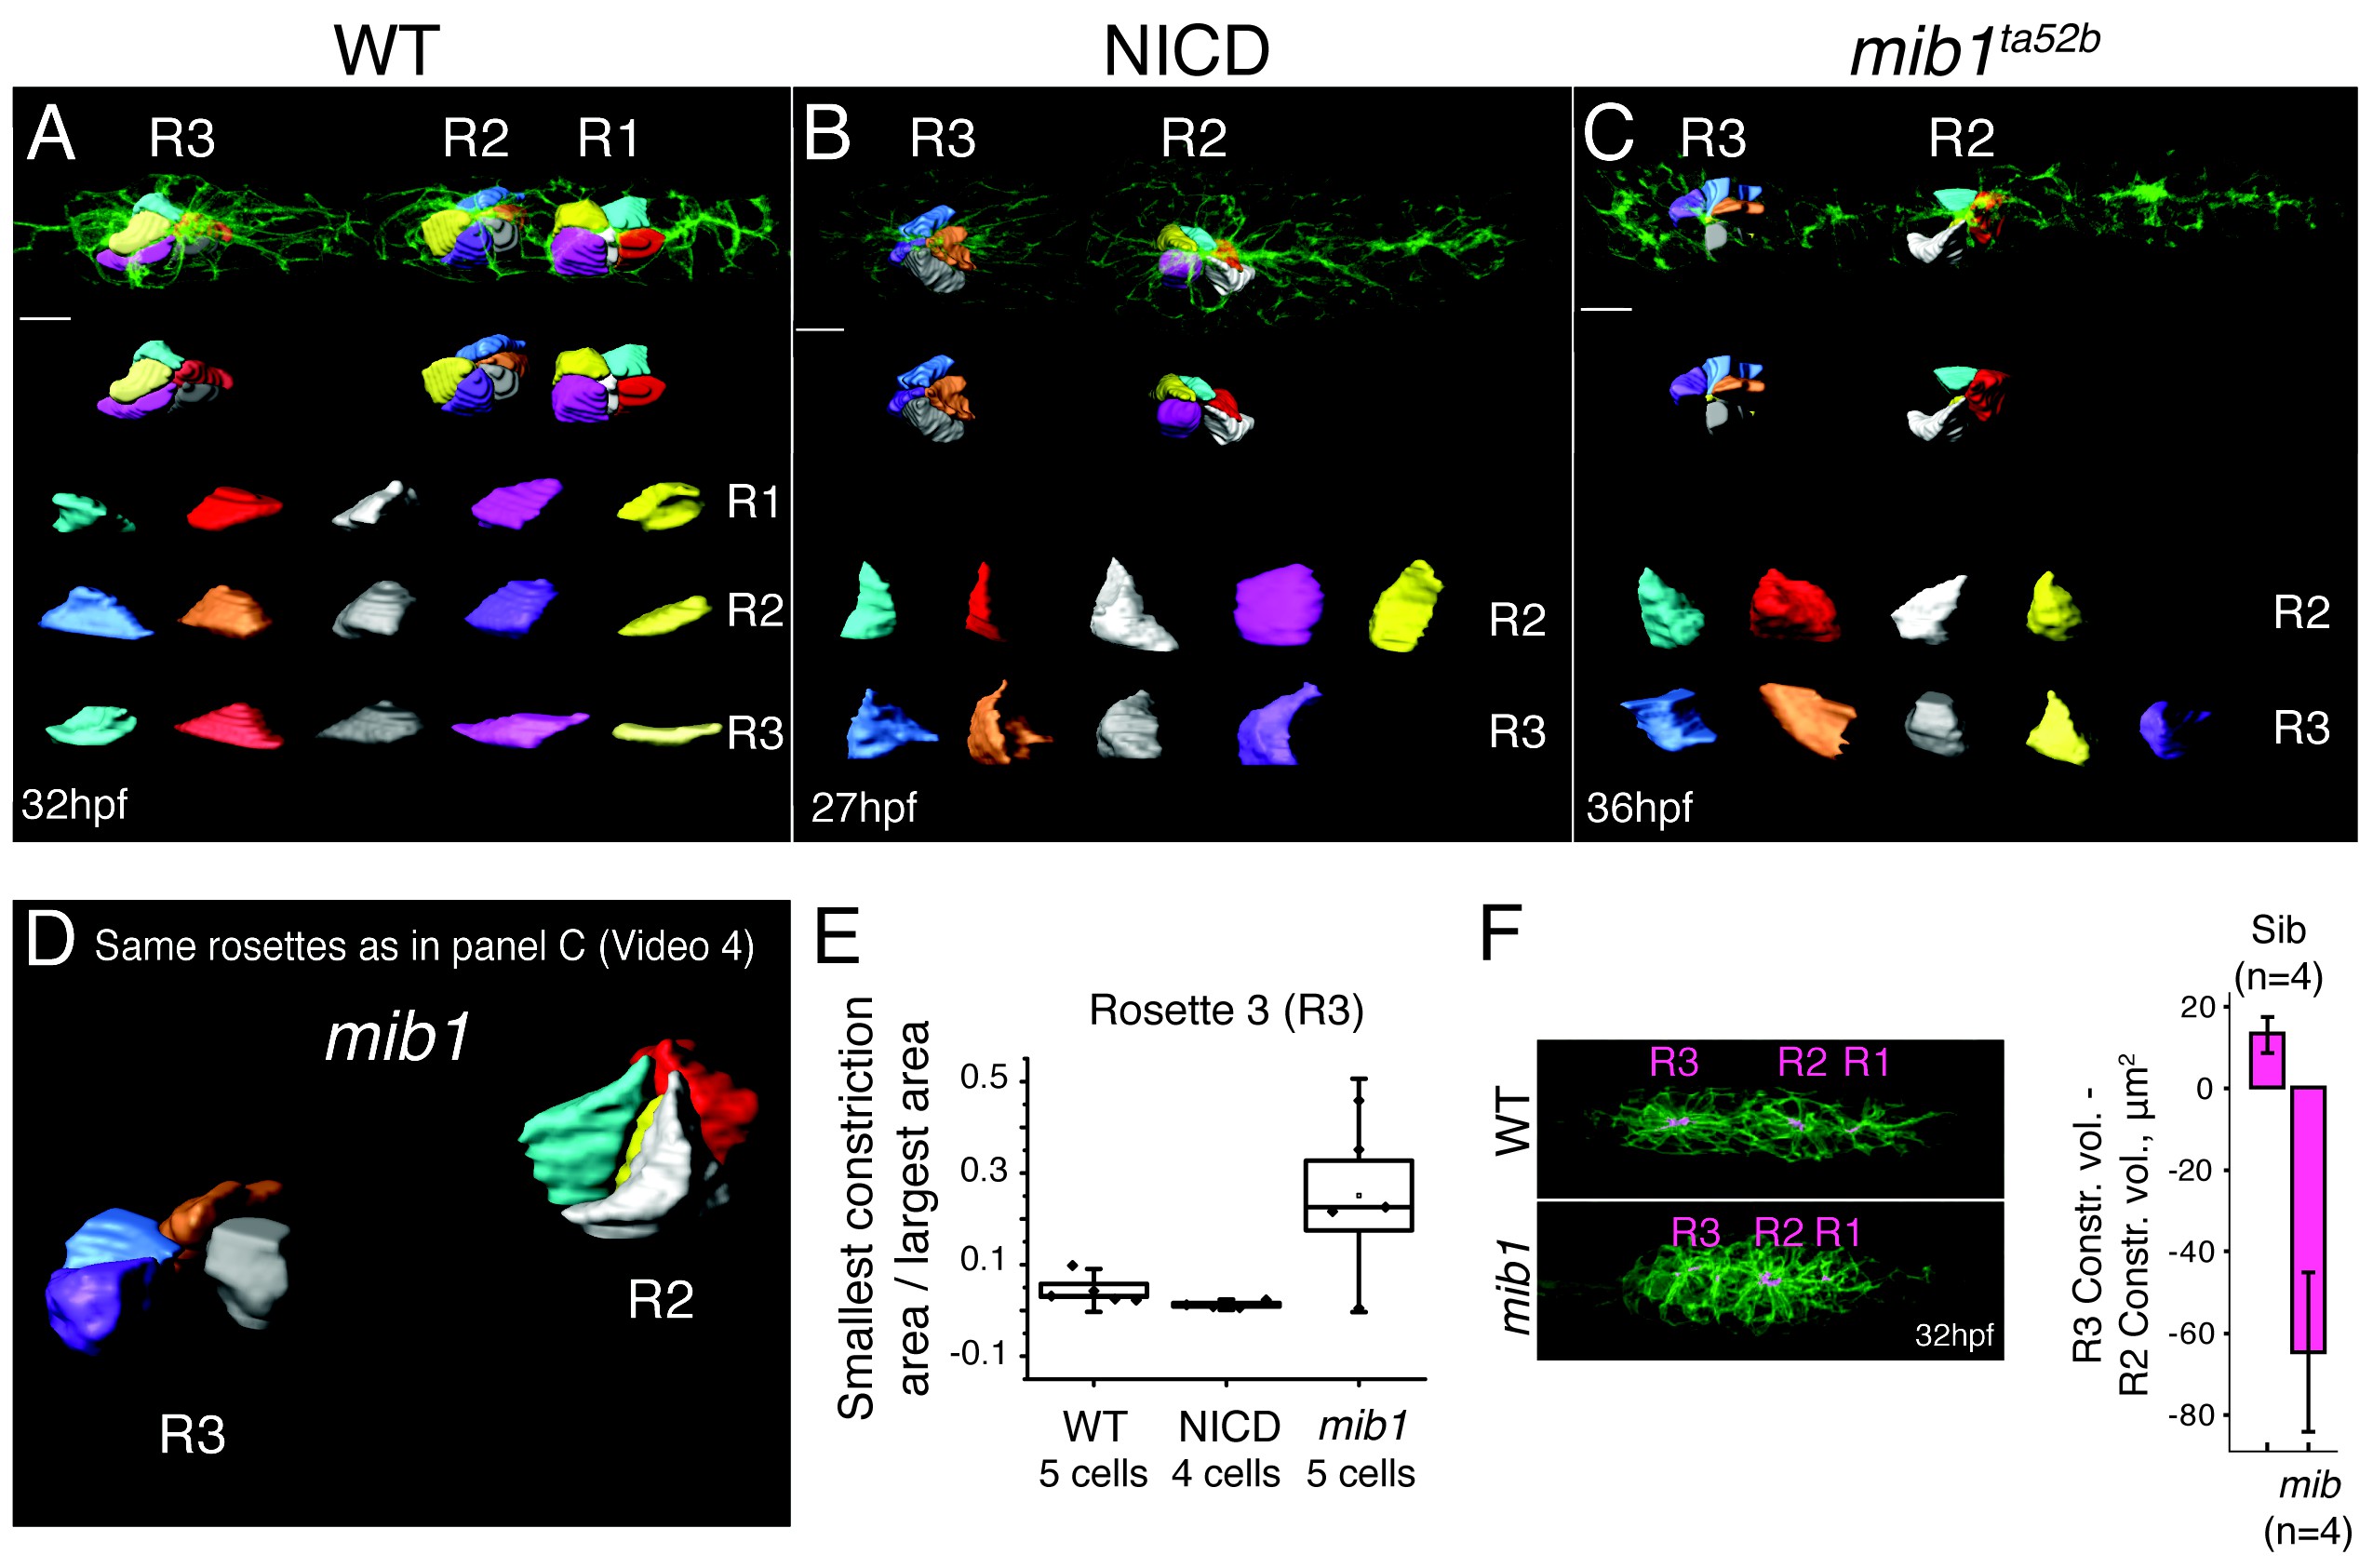
Fig. 6
Loss of Notch signaling disrupts apical constrictions.
(A–E) Analysis of cell shapes using Imaris software. R1–R3 indicate proneuromast numbers. (A) In wildtype and (B) NICD primordia all analyzed proneuromast cells in all rosettes constrict apically. Cells in a mib1ta52b primordium (C) constrict in the more immature rosette (R2) but are lacking constricted apices in the last proneuromast (R3) at 36 hpf. The scale bars equal 10 μm. While the individual cells within one graph are scaled the same with respect to each other, no comparison can be made between different samples. This is due to the limitations of the Imaris scale bar function, rooted in the complexity of displaying 3D data. (D) Still image of an animation of the same primrodium as in (C) demonstrating the shape changes in R3. (E) Quantification of apical constrictions (area). Cells from the most mature proneuromasts (R3) were selected for analysis. Boxplot defines standard error and the ends of the whiskers show standard deviation between different cells. (F) The bar graph shows the apical constriction volume value when the R2 volumes are subtracted from R3 volumes. Constriction volumes gradually diminish in maturing proneuromasts in mib1ta52b primordia, therefore, the last proneuromast (R3) in mib mutants has a significantly smaller constriction volume in comparison to R2, whereas, in the siblings R3 is larger than R2, which results in a positive value.