
Fig. 7
- ID
- ZDB-IMAGE-171205-42
- Genes
- Publication
- Poureetezadi et al., 2016 - Prostaglandin signaling regulates nephron segment patterning of renal progenitors during zebrafish kidney development
- All Figures
- Figures for Poureetezadi et al., 2016
|
Fig. 7
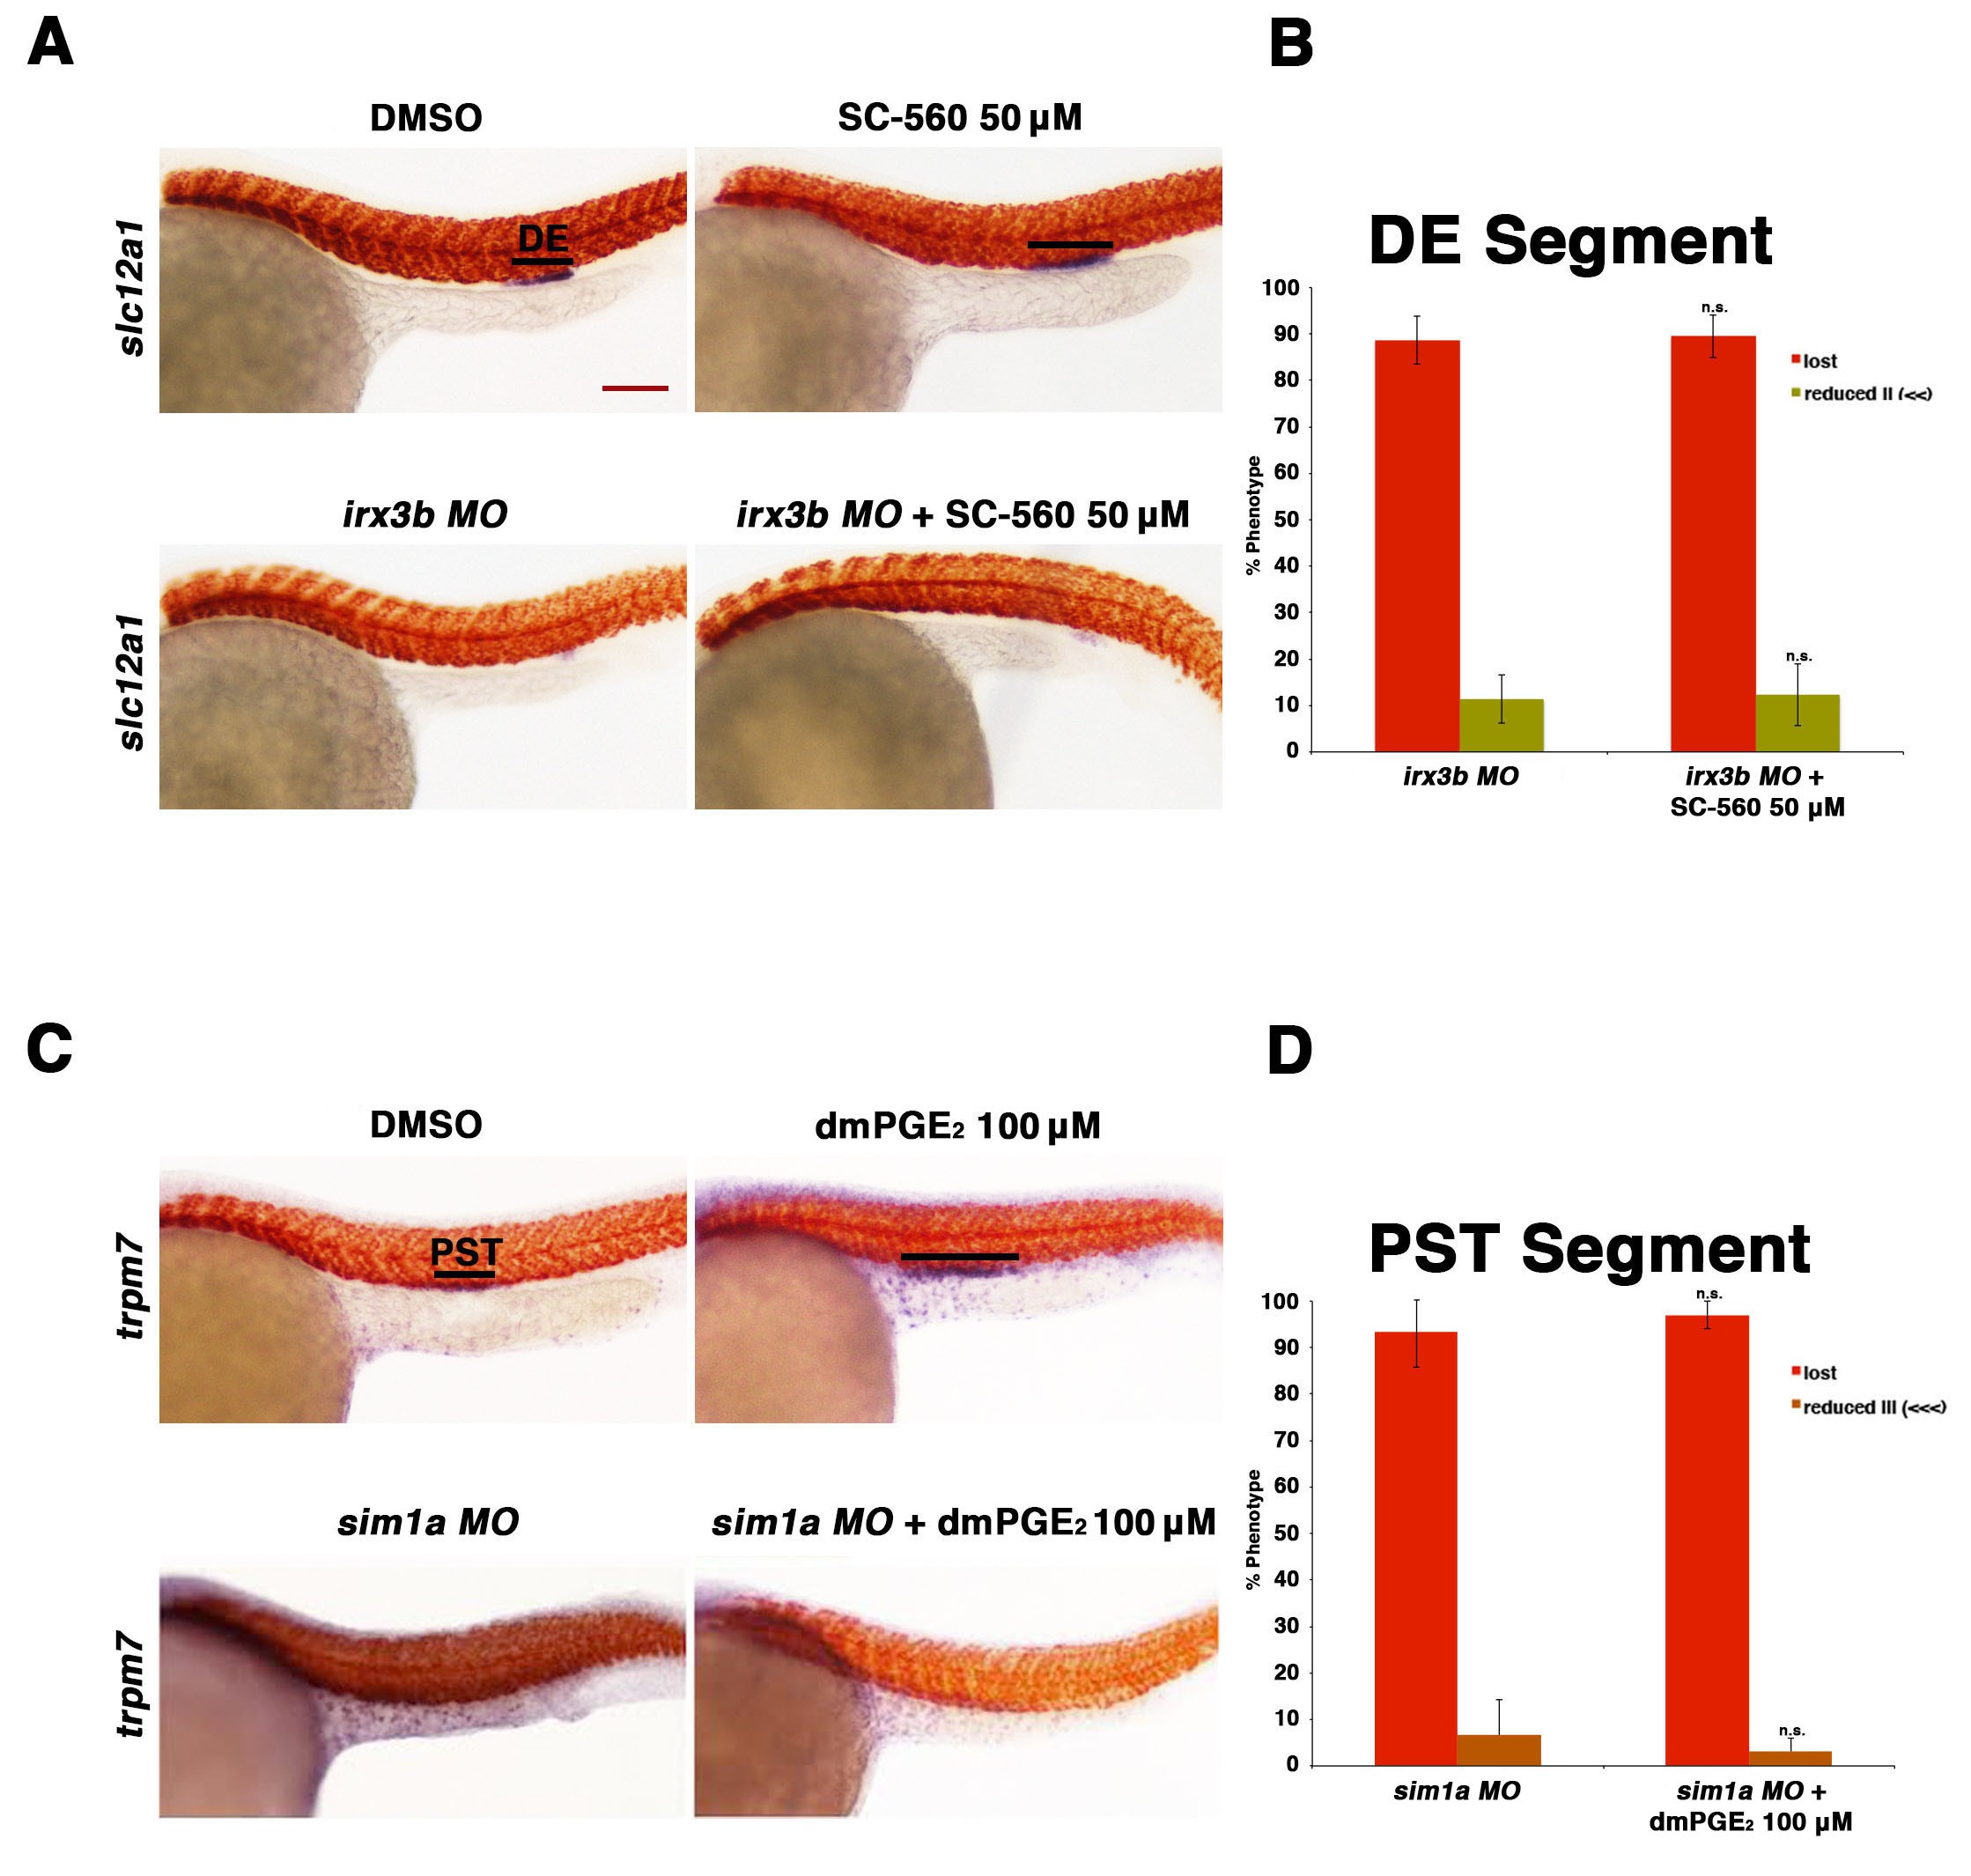
Prostaglandin signaling acts upstream of the transcription factors sim1a and irx3b.
(A) Embryos were microinjected with the irx3b MO and treated with 0.5% DMSO or 50 µM SC-560 from 4 hpf to 24 hpf and stained for the DE using WISH. WT control embryos were also treated with 0.5% DMSO and 50 µM SC-560. (B) The DE (slc12a1) (purple) was stained for using WISH and quantified in triplicate, with at least 20 embryos per control and experimental group, by observing for the presence of the DE segment at the 24 hpf stage. Black bars indicate segment gene expression domain. Red scale bar, 70 µm. (C) Embryos were microinjected with the sim1a MO then treated with either 1% DMSO or 100 µM dmPGE2 from 4 hpf to 24 hpf. 1% DMSO and 100 µM dmPGE2 was also applied to WT control embryos from 4 hpf to 24 hpf. The PST (purple) and somites (red) were then stained for using WISH. (D) Quantification was undertaken in triplicate based on the presence of a PST or lack thereof, with at least 20 embryos per control and experimental group. Data are represented as ± SD, with t tests comparing each drug treatment to the corresponding DMSO control group, where n.s. indicates not significant.