
IMAGE
Fig. 5
- ID
- ZDB-IMAGE-171205-39
- Publication
- Poureetezadi et al., 2016 - Prostaglandin signaling regulates nephron segment patterning of renal progenitors during zebrafish kidney development
- All Figures
- Figures for Poureetezadi et al., 2016
Image
|
Figure Caption
Fig. 5
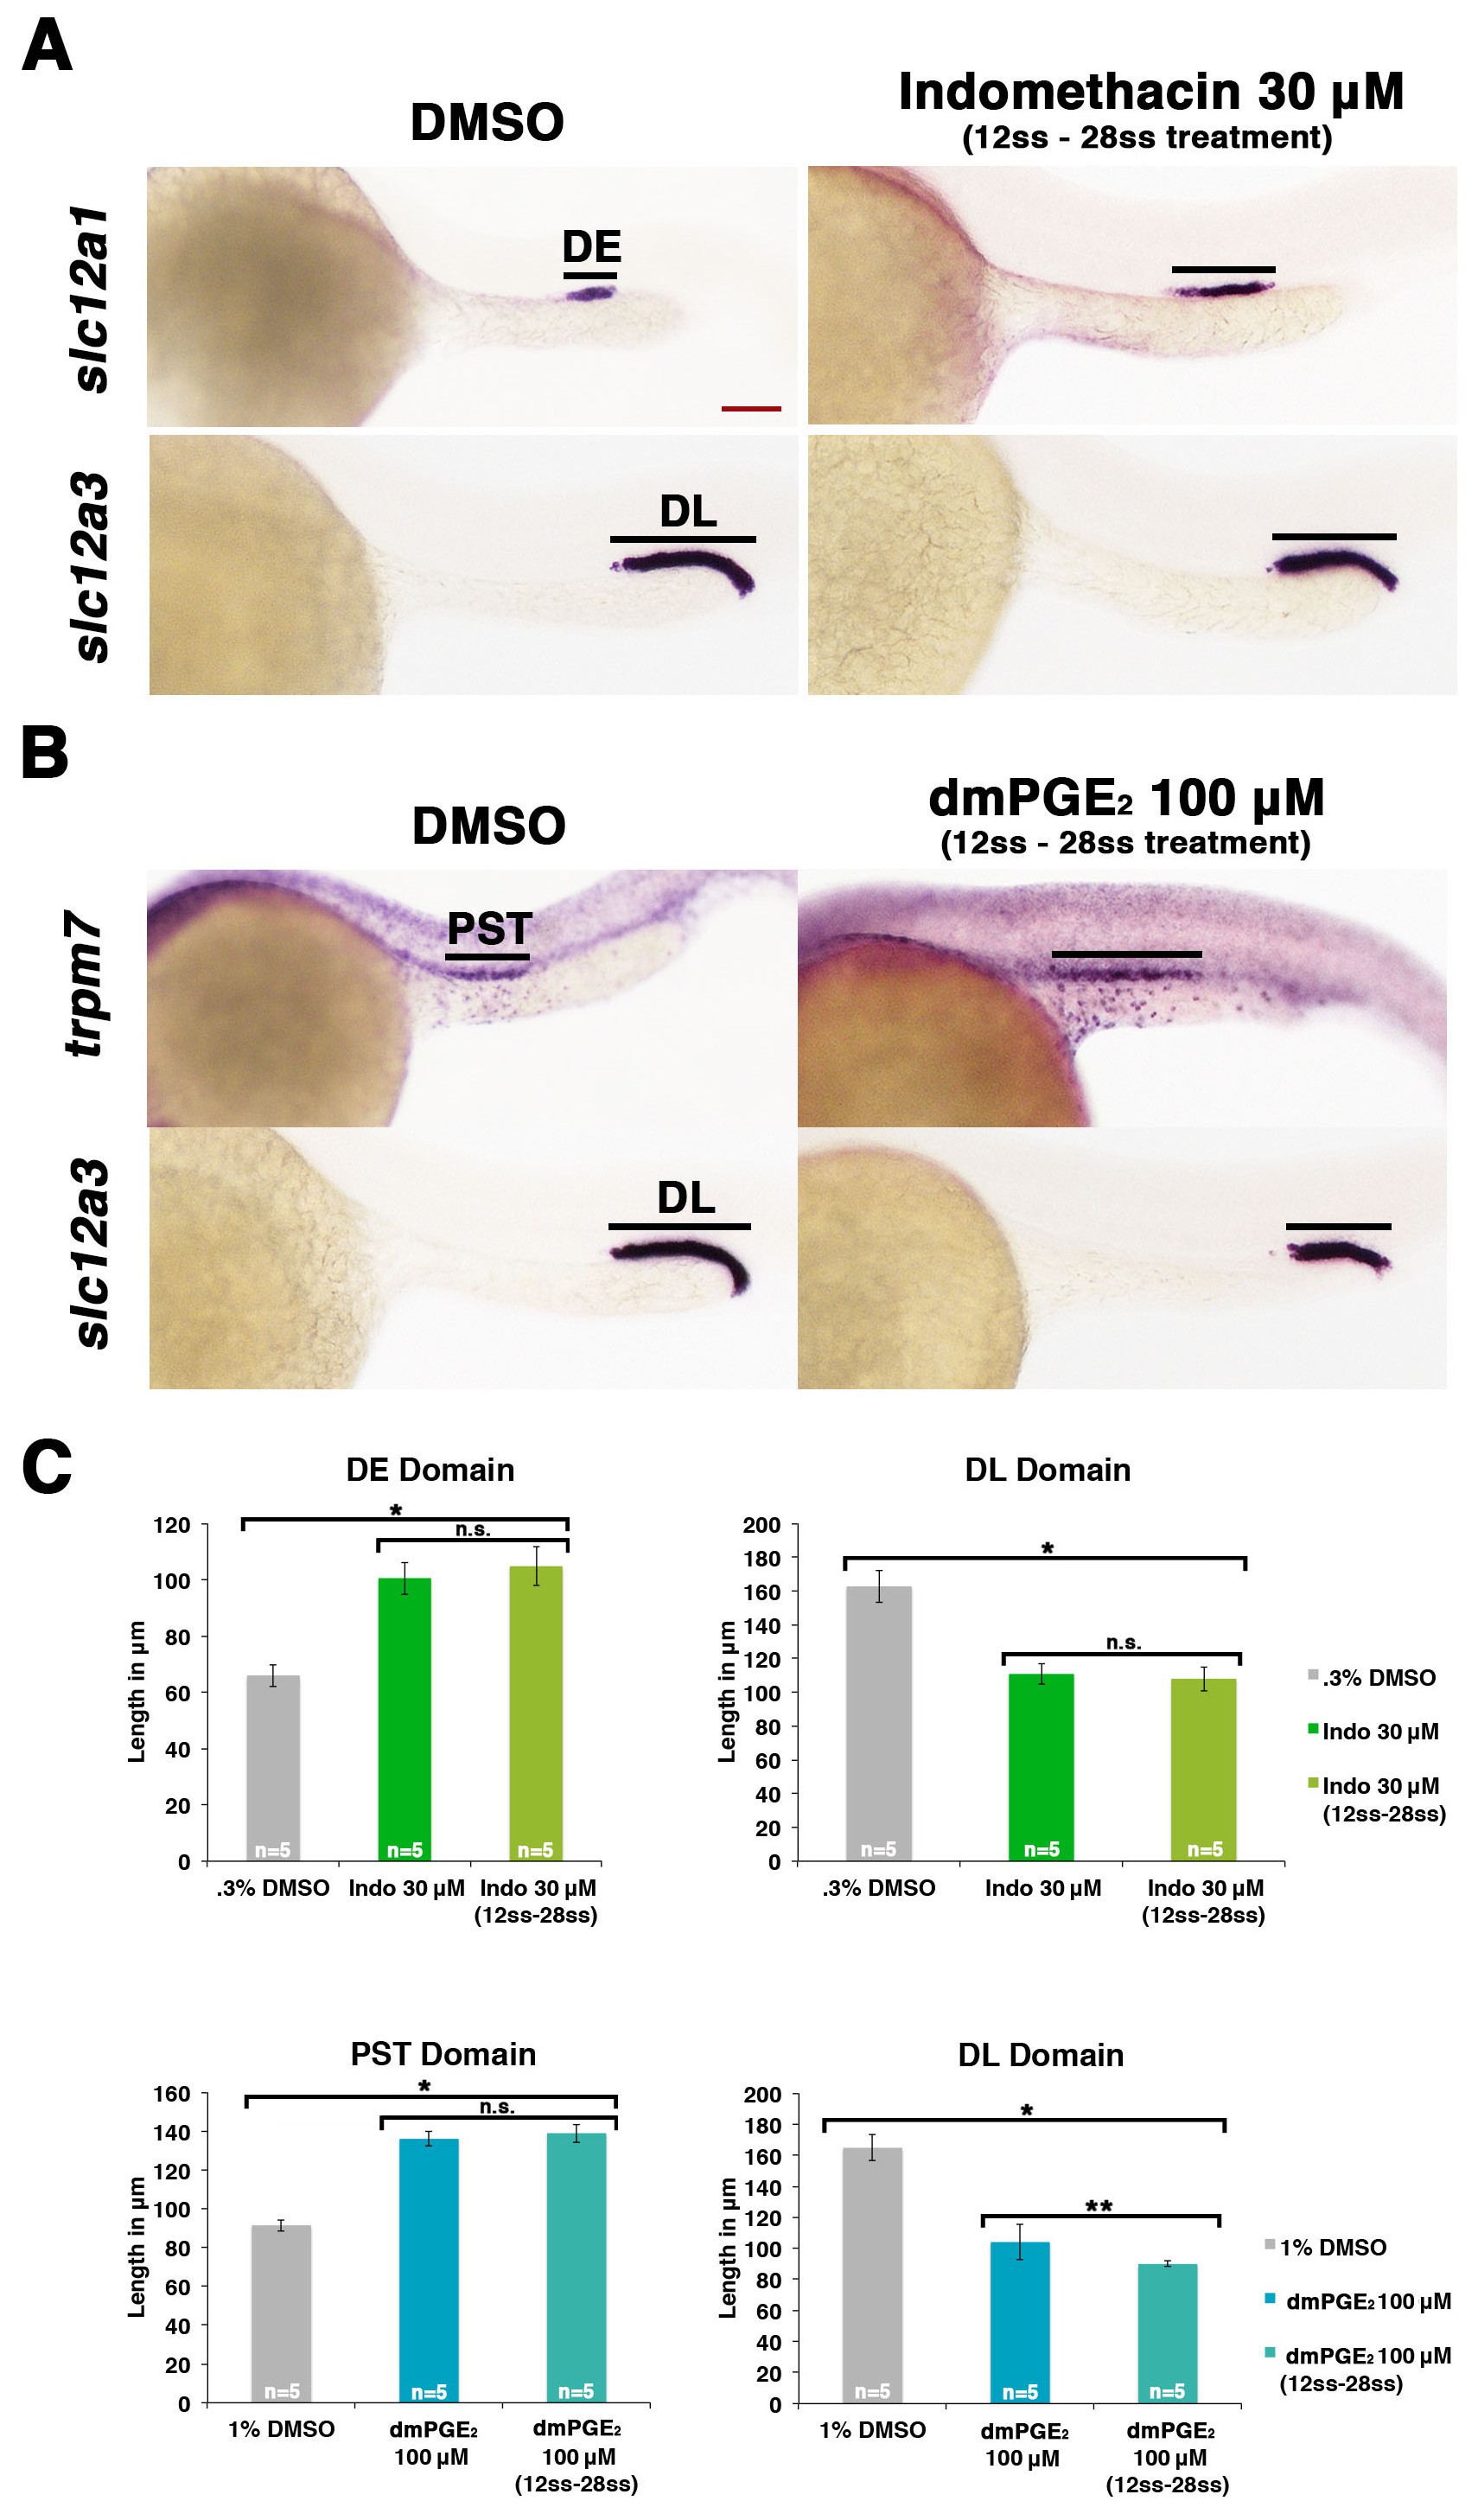
Prostaglandin signaling influences nephron patterning after gastrulation.
Embryos were treated with 0.3% DMSO or 1% DMSO vehicle control, (A) 30 μM indomethacin, or (B) 100 μM dmPGE2 from the 12 ss to the 28 ss and stained for the PST (trpm7), DE (slc12a1), and DL (slc12a3) (purple) using WISH at the 28 ss stage. Black bars indicate segment gene expression domain. Red scale bar, 70 µm. (C) The PST, DE, and DL domains were measured in microns (n = 5 for each control and experimental group). Data are represented as ± SD, ANOVA used to compare samples, *p<0.01, **p<0.05, where n.s. indicates not significant.
Acknowledgments
This image is the copyrighted work of the attributed author or publisher, and
ZFIN has permission only to display this image to its users.
Additional permissions should be obtained from the applicable author or publisher of the image.
Full text @ Elife