
|
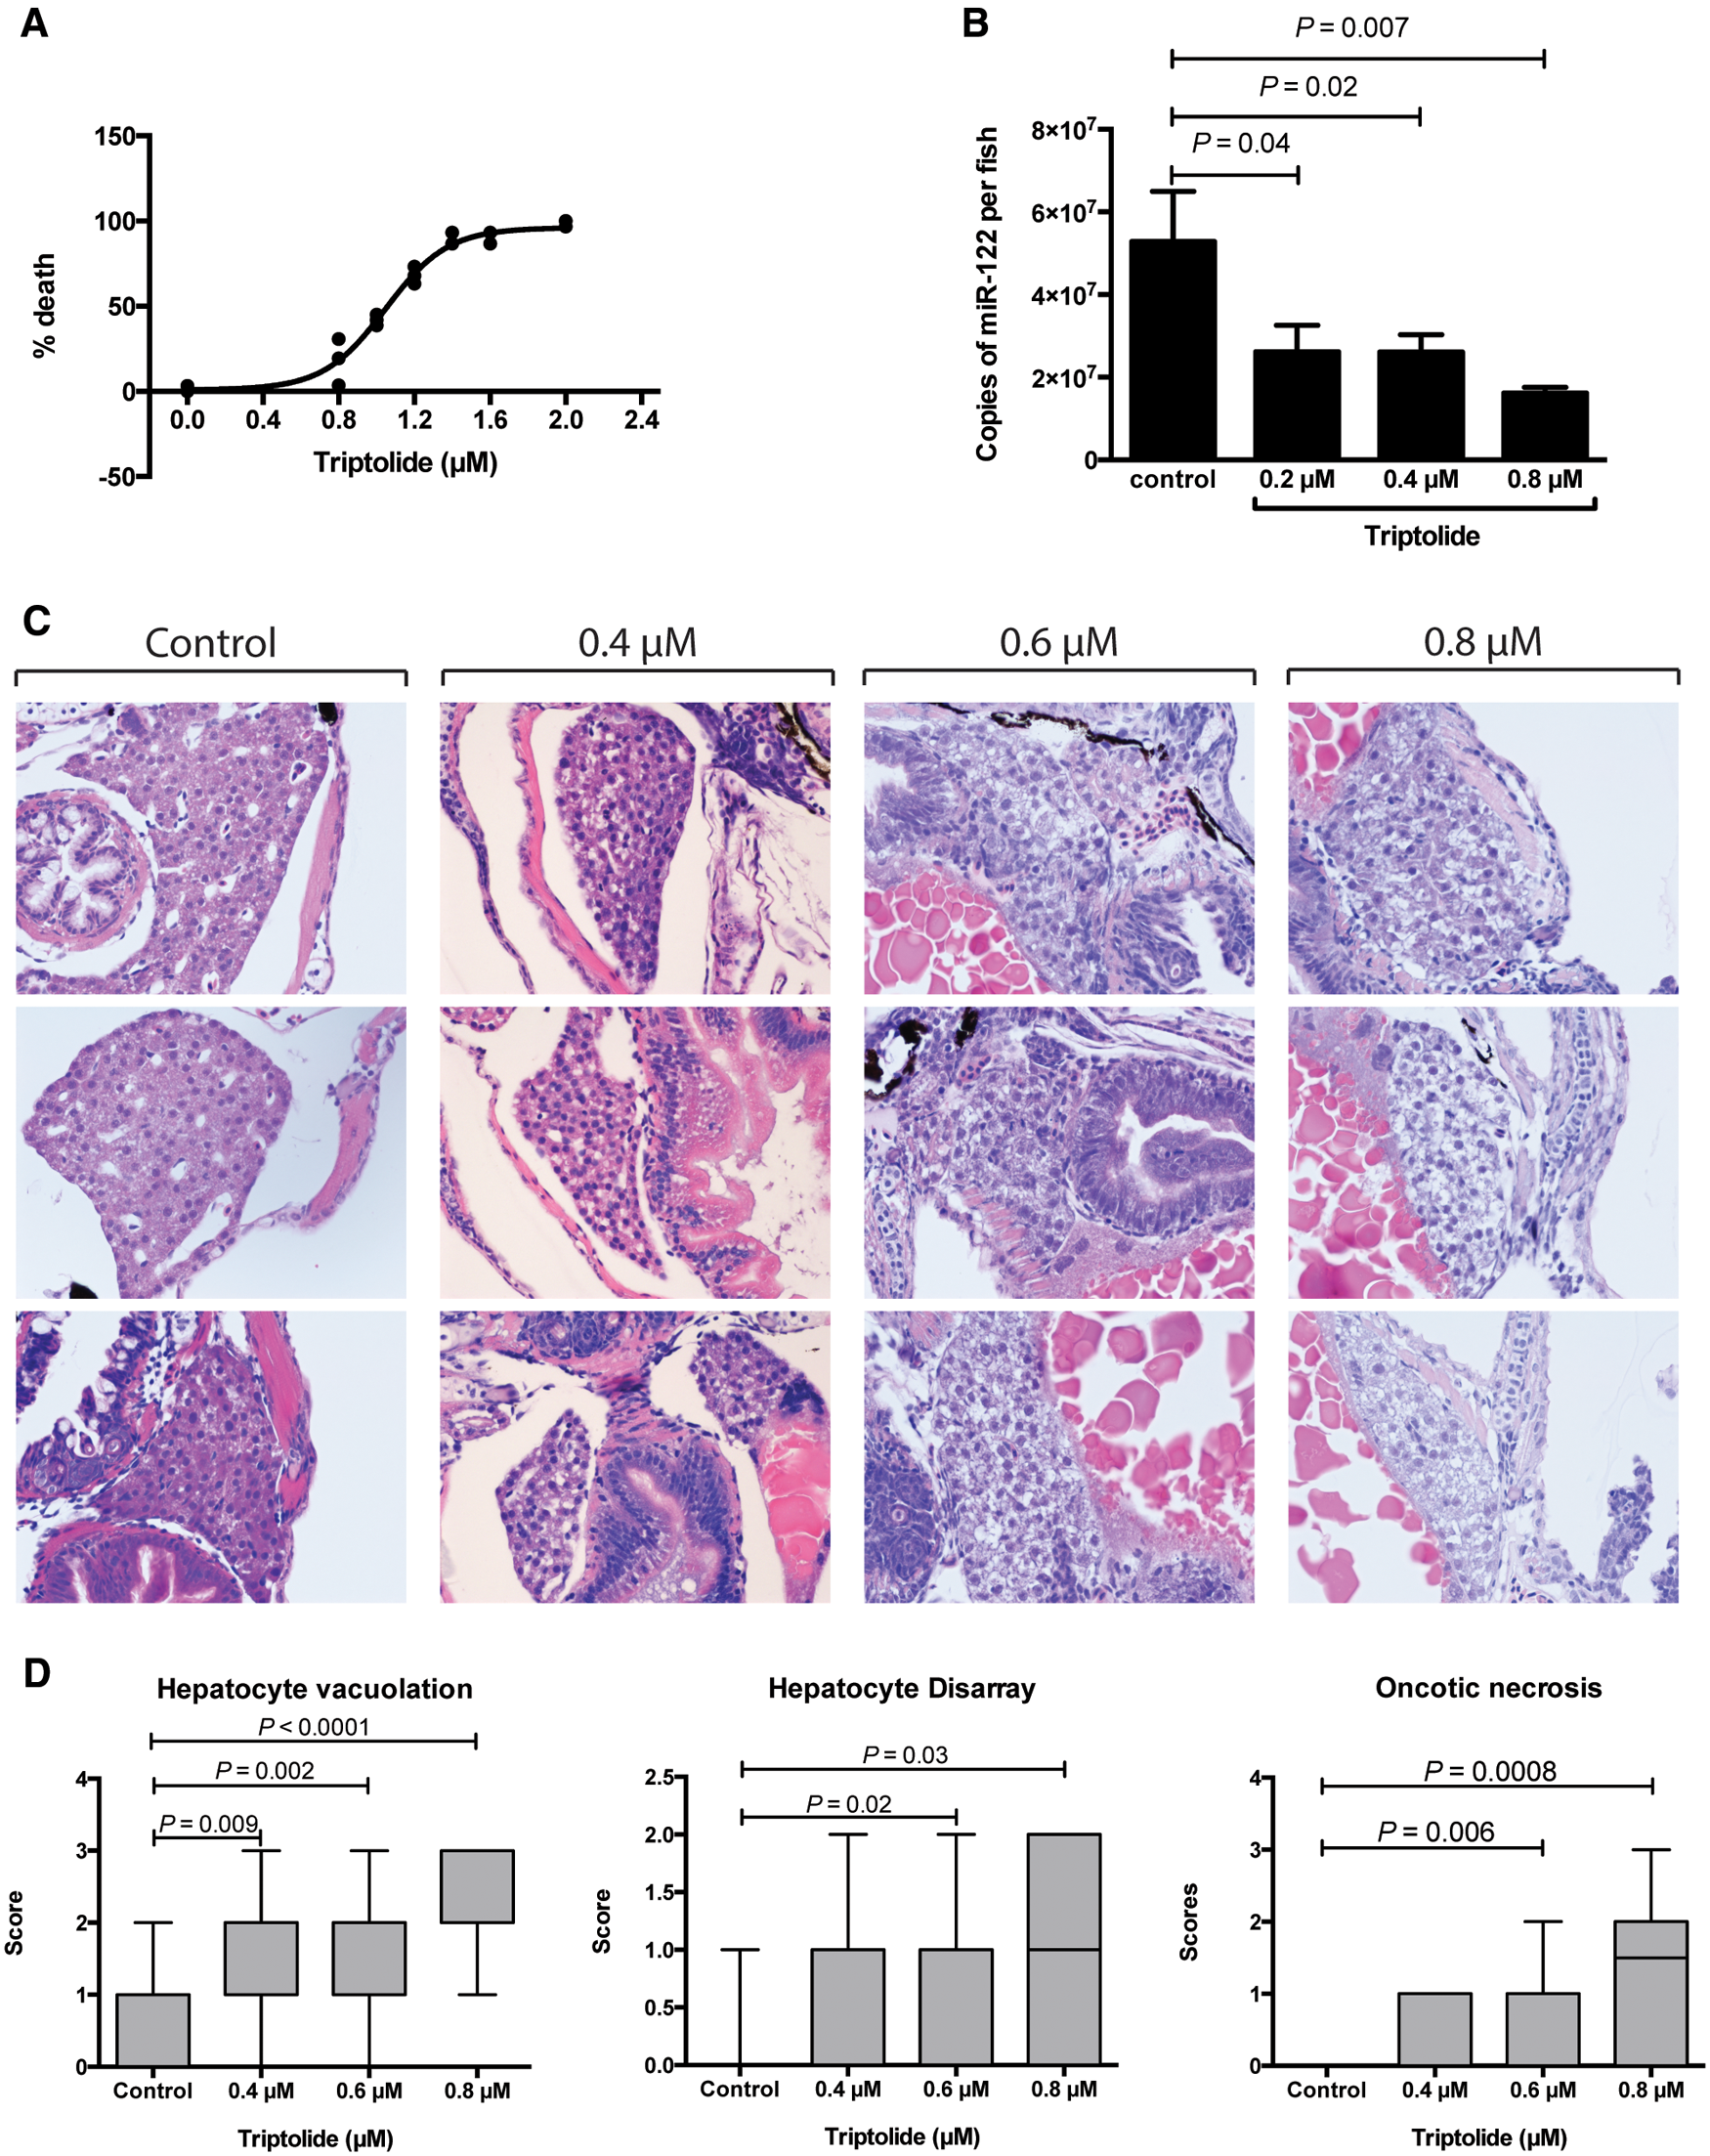
Fig. 1
Effect of triptolide on zebrafish larvae after 48 h (3–5 dpf) exposure. A, Survival of zebrafish larvae after TP exposure at the concentrations indicated. Each dot represents mean mortality of 30 larvae. B, Copies of miR-122 per larva after 48 h of exposure at the concentrations indicated (from 3 to 5 dpf). C, Histological images of zebrafish larvae after exposures of the TP concentrations indicated. Three representative fish are presented per TP dose. D, Box plots (min to max) of histology scores for hepatocyte vacuolation, hepatocyte disarray and oncotic necrosis after TP exposure at the concentrations indicated (control N = 12, 0.4 µM N = 20, 0.6 µM =18 and 0.8 µM N = 18).