
|
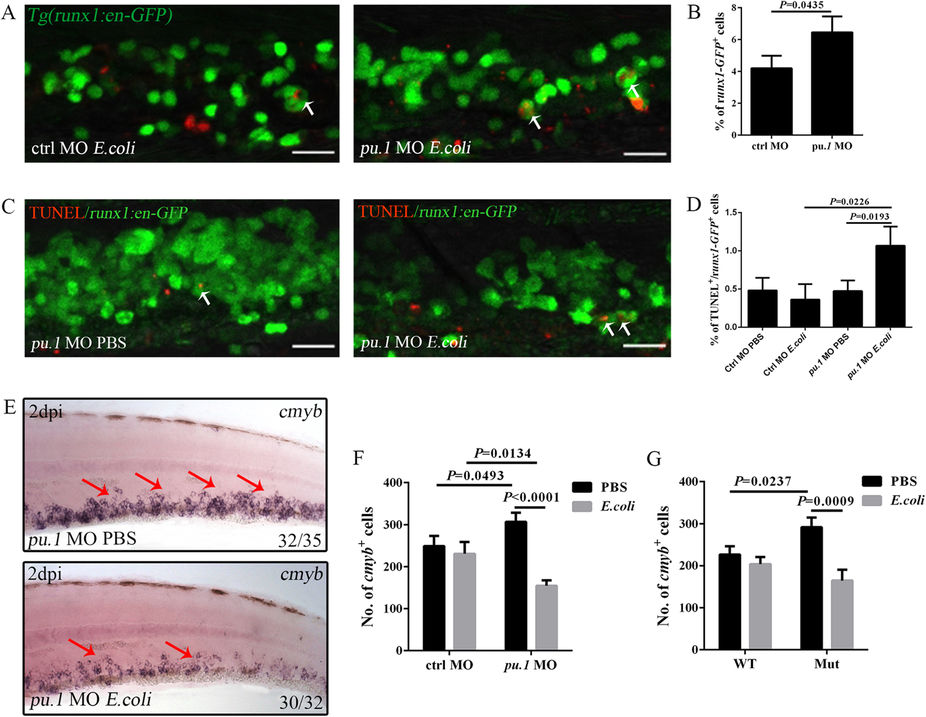
Fig. 7
Pu.1 deficiency causes excessive HSPC apoptosis after intravenous E. coli (5–10 × 103 cfu) infection.
(A,B), Fluorescence images (A) and calculation (B) of runx1-GFP+ cells that phagocytose (white arrows) E. coli in the control (4.20 ± 0.79; N = 13) or pu.1 morphant (6.46 ± 1.0; N = 11) CHT at 6 hpi. (C), The fluorescence images of double staining by GFP and TUNEL in the CHT of PBS or E. coli-treated pu.1 morphants Tg(runx1:en-GFP) embryos at 2 dpi (4dpf). White arrows show the co-localization of TUNEL and GFP signals. (D), The percentage of TUNEL+/runx1-GFP+ in each group at 2 dpi (4 dpf) (Ctrl MO PBS: 0.48 ± 0.16; Ctrl MO E. coli: 0.36 ± 0.20; pu.1 MO PBS: 0.47 ± 0.14; pu.1MO E. coli: 1.07 ± 0.25. N ≥ 8 in each group). (E), WISH of cmyb (red arrows) in the CHT of the PBS or E. coli-treated pu.1 morphants at 2 dpi (4 dpf). (F), The numbers of cmyb+ cells in the CHT of treated control (230.80 ± 28.00 vs 248.80 ± 24.50 in E. coli vs PBS group. N = 10 in each group) or pu.1 morphants (154.40 ± 13.03 vs 306.60 ± 21.68 in E. coli vs PBS group. N = 10 in each group). (G) The numbers of cmyb+ cells in the CHT of the treated WT (203.80 ± 17.06 vs 226.40 ± 20.07 in E. coli vs PBS group. N = 10 in each group) or pu.1G242D/G242D embryos (164.80 ± 25.60 vs 291.70 ± 23.22 in E. coli vs PBS group. N = 10 in each group) at 2 dpi (4 dpf).