
Fig. 1
- ID
- ZDB-IMAGE-171129-3
- Genes
- Publication
- Hou et al., 2016 - Systemic inoculation of Escherichia coli causes emergency myelopoiesis in zebrafish larval caudal hematopoietic tissue
- All Figures
- Figures for Hou et al., 2016
|
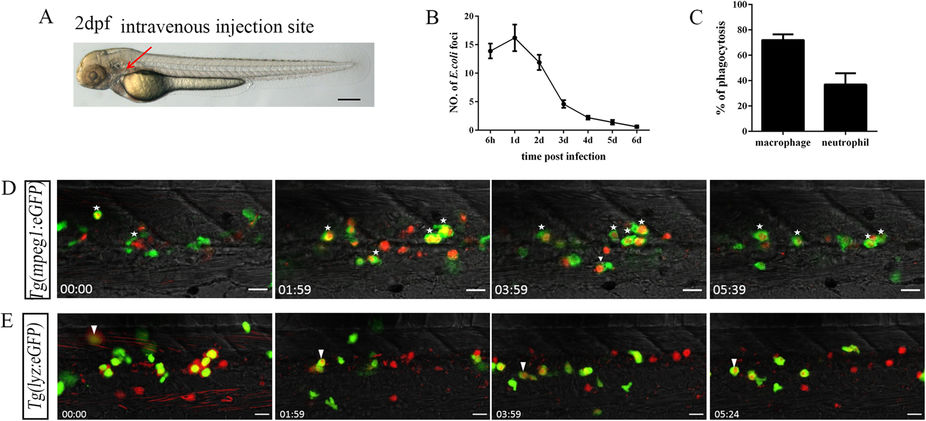
Fig. 1
Bacterial (E. coli) phagocytosis by both macrophages and neutrophils following intravenous injection.
(A), The intravenous injection site (red arrow) of E. coli (5–10 × 103 cfu) in 2 dpf embryo. Scale bars, 200 μm. (B), The numbers of Dsred+ E. coli foci in the CHT regions at different time points after injection (13.90 ± 1.31; 16.20 ± 2.35; 11.90 ± 1.33; 4.60 ± 0.65; 2.20 ± 0.33; 1.40 ± 0.40; 0.60 ± 0.22 at each time points; 10 embryos were counted in each group). (C), The percentage of macrophages (72.06 ± 4.44, N = 8) and neutrophils (36.93 ± 8.89, N = 8) involved in bacterial phagocytosis at 6 hpi in the CHT. (D,E), Time-lapse imaging of an infected Tg(mpeg1:eGFP) (D) or Tg(lyz:eGFP) (E) CHT from 0.5 hpi to 6 hpi. The white stars in (D) denote mpeg1-GFP+ macrophages that engulfed large amounts of Dsred+ E. coli. The white arrowheads in (E) indicate the initial aggregation of Dsred+ E. coli on the surface of lyz-GFP+ neutrophils, which were quickly phagocytosed. The red foci in (D,E) represent the phagocytosed bacteria. Scale bars, 20 μm. See also Video S1 and S2.