
|
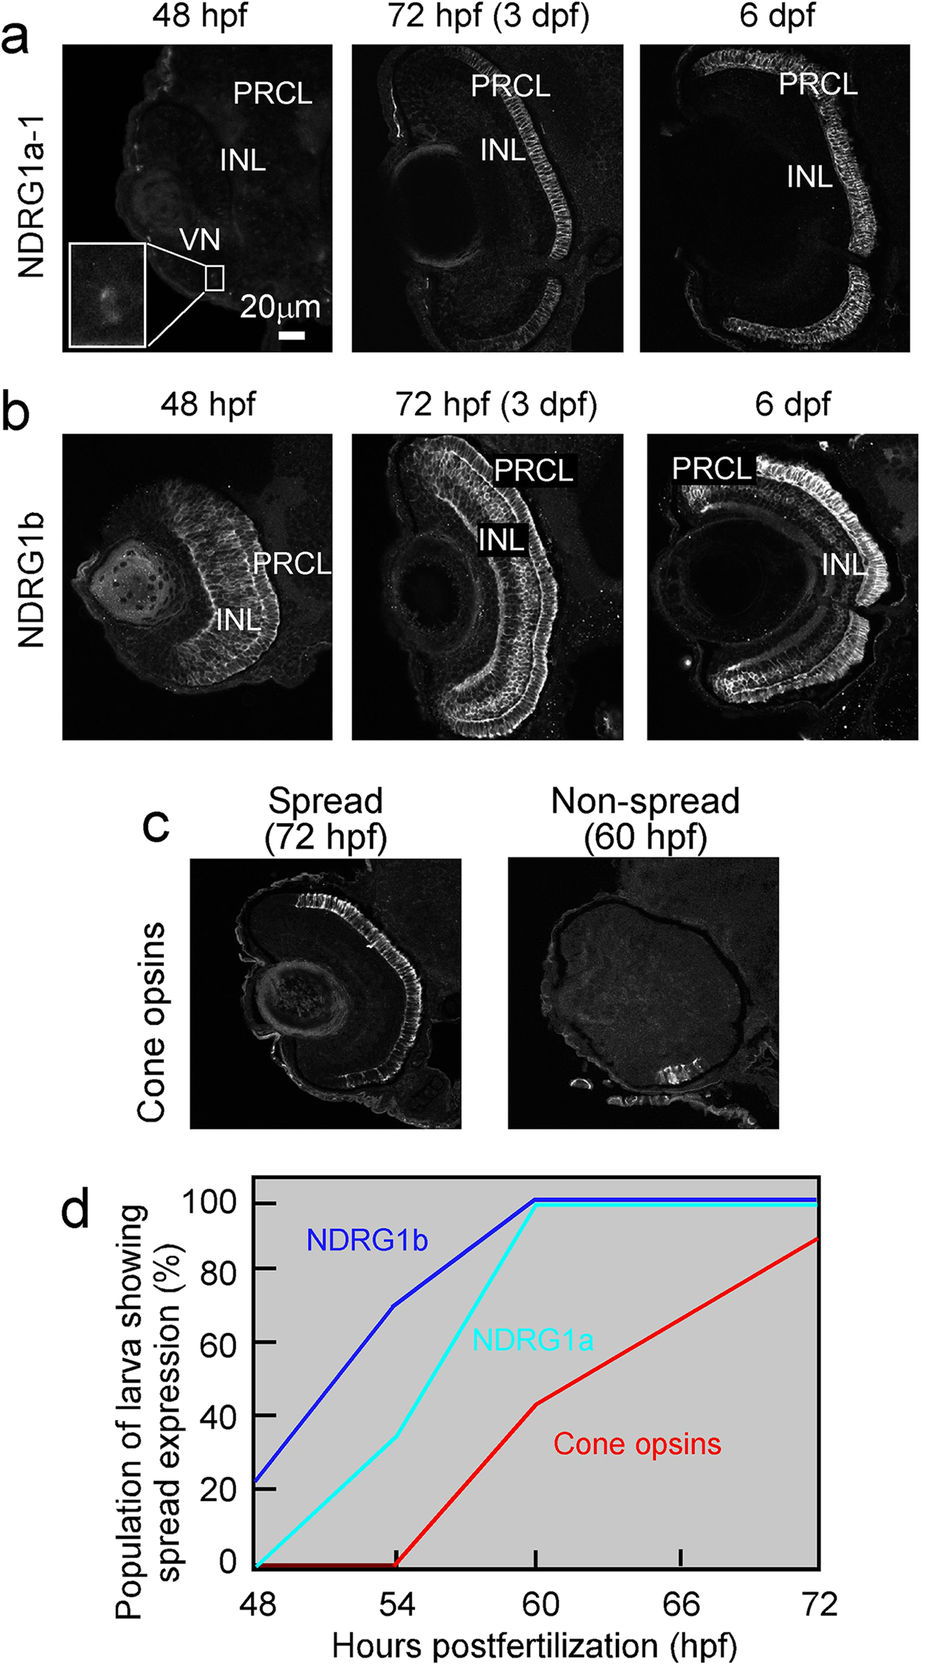
Fig. 3
Spatiotemporal expression patterns of NDRG1a-1 and NDRG1b proteins.
NDRG1a-1 (a) and NDRG1b (b) were probed with specific antisera against them at the developmental stages indicated. In (a) at 48 hpf, NDRG1a-1 was detected only in the region of ventronasal patch (VN), and subsequently it was detected in the photoreceptor cell layer (PRCL) but not in the inner nuclear layer (INL). In (b), NDRG1b was detected at both the PRCL and INL at 48 and 72 hpf, and its distribution was enriched to PRCL at 6 days postfertilization (dpf). The expression level of each protein at indicated time was estimated with spread/non-spread criterion (c, see Methods), and the result is shown together with that obtained for total cone opsins (d). In (d), data point is the percentage of the number of the retinas showing “spread” image in the total number of the retinas examined (n = 8–10) at each time point (48, 54, 60 and 72 hpf). Magnifications are the same in (a–c) (scale bar, 20 μm).