
Image
|
Figure Caption
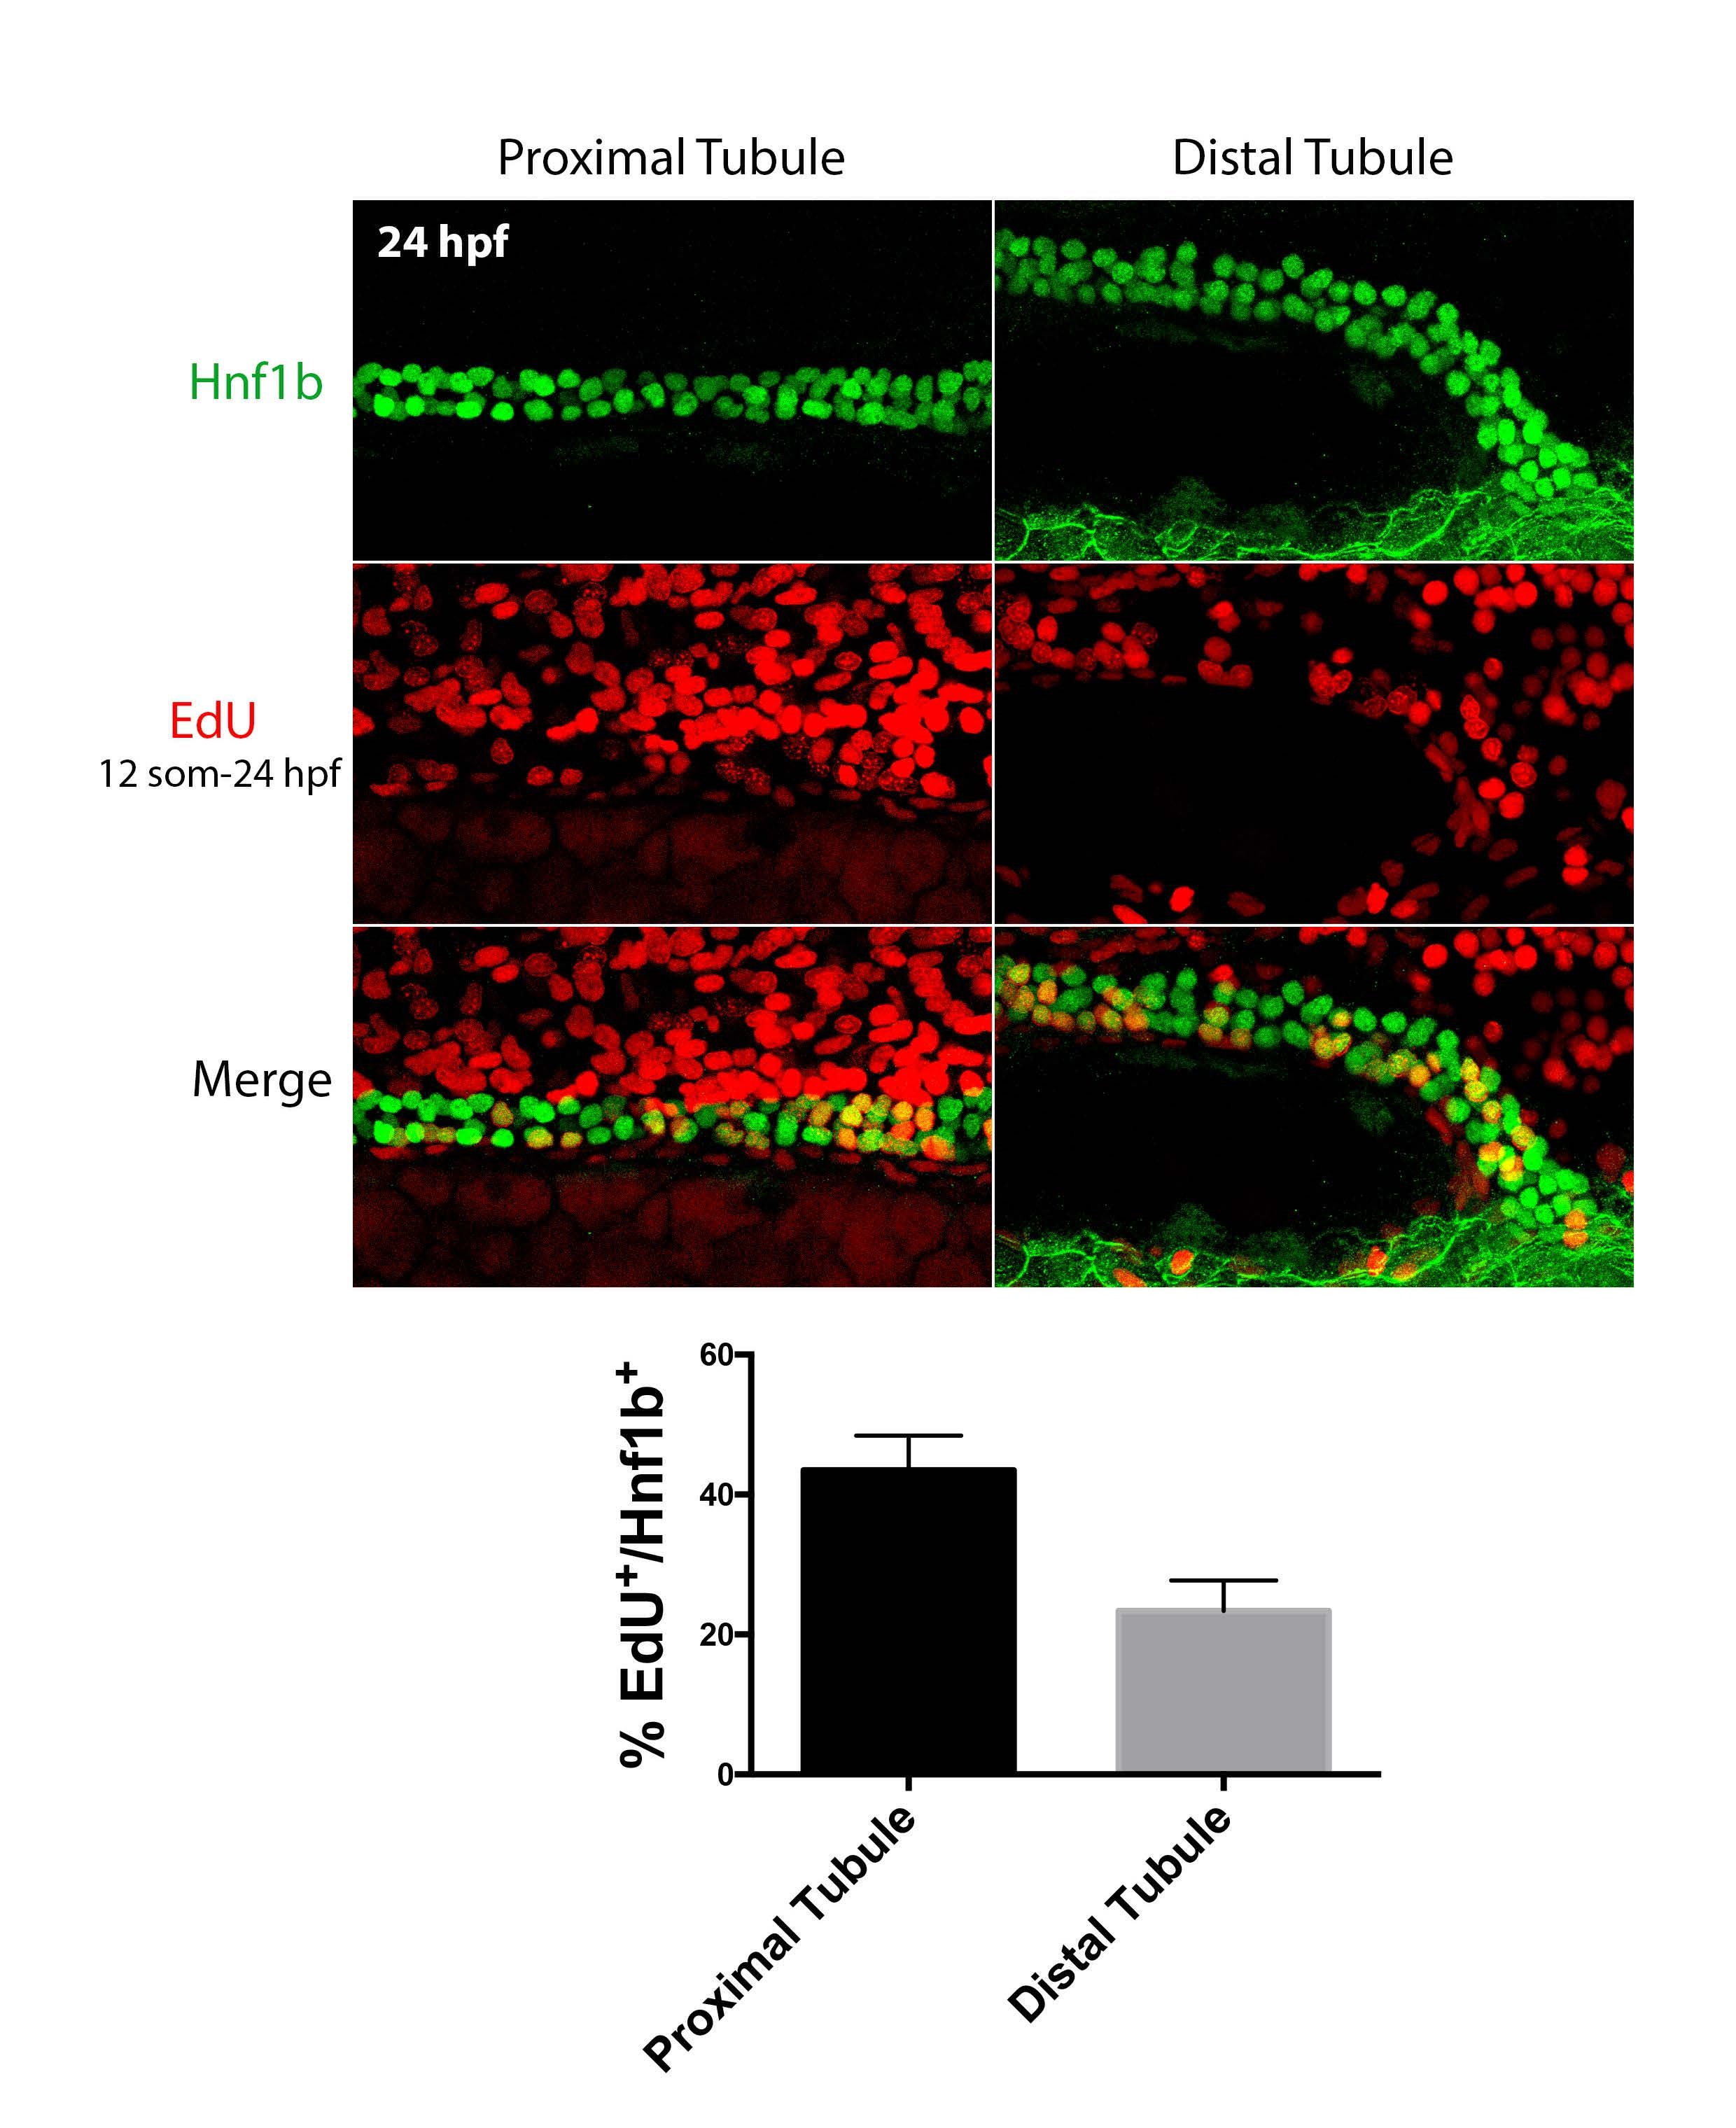
Fig. S4
Top panels show Hnfl b (green) and EdU (red) in the proximal tubule region (left) and distal tubule (right). Histogram at the bottom shows the% of Hnfl b nuclei that are labelled for EdU in the proximal tubule and distal tubule.
Acknowledgments
This image is the copyrighted work of the attributed author or publisher, and
ZFIN has permission only to display this image to its users.
Additional permissions should be obtained from the applicable author or publisher of the image.
Full text @ Sci. Rep.