
Fig. 1
- ID
- ZDB-IMAGE-171117-10
- Publication
- Kamezaki et al., 2016 - Visualization of Neuregulin 1 ectodomain shedding reveals its local processing in vitro and in vivo
- All Figures
- Figures for Kamezaki et al., 2016
|
Fig. 1
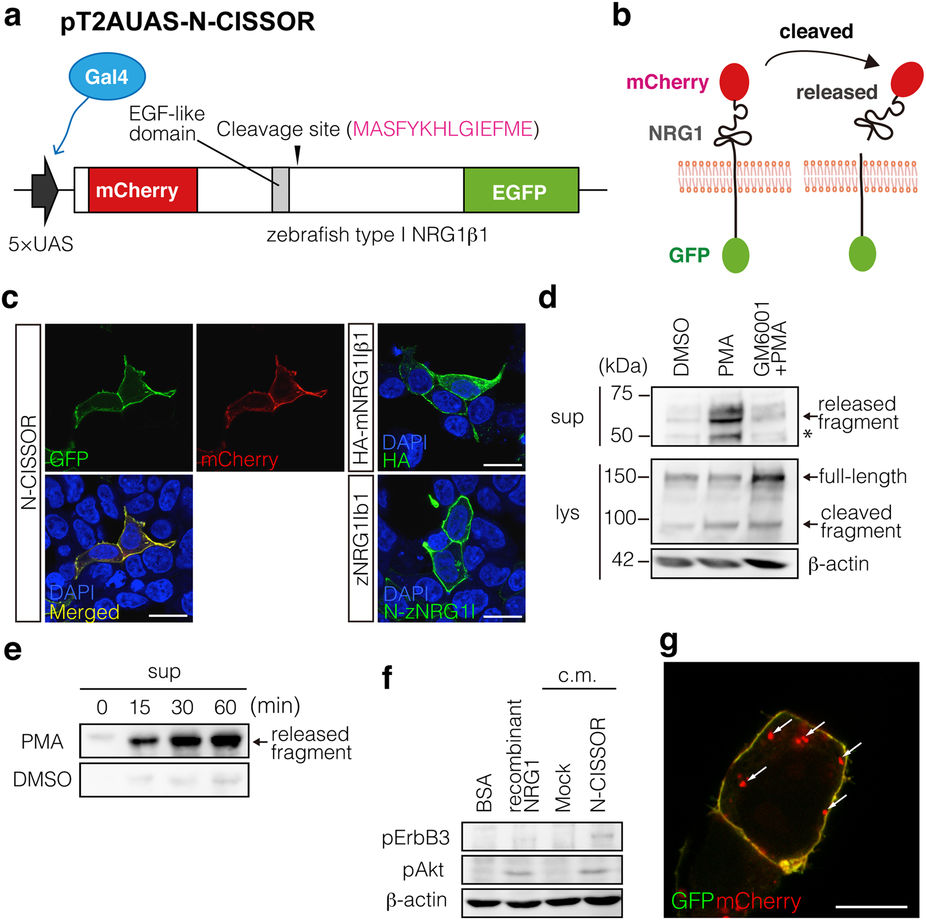
Generation of N-CISSOR probe.
(a) N-CISSOR, type-I zebrafish NRG1β1 (zNRG1Iβ1) constructed with an extracellular mCherry and an intracellular GFP, was expressed under the control of a 5× UAS sequence, which was driven by Gal4. (b) N-CISSOR was designed to monitor intramolecular NRG1 cleavage, which resulted in physical separation of mCherry and GFP. Ectodomain-shedding activities were assessed as relative values of the mCherry/GFP ratios. (c) Cellular localization of N-CISSOR expressed in HEK293T cells compared with those of immunodetected HA-mNRG1Iβ1 and unlabelled zNRG1Iβ1. Scale bar: 20 μm. (d,e) Western blot analysis of N-CISSOR dynamics. Released (1st panel) and full-length (2nd panel) N-CISSOR fragments were detected using anti-mCherry and anti-GFP antibodies, respectively. β-actin was detected as an internal control (3rd panel). An asterisk shows the extra bands produced by the intramolecular cleavage of mCherry during the denaturation procedure. (d) Metalloprotease-dependent N-CISSOR cleavage induced by PMA treatment for 20 min. Pre- and co-treatment with GM6001 for 30 min inhibited the PMA-induced release of ectodomain fragments. (e) Time-dependent N-CISSOR release induced by PMA treatment. The supernatants of N-CISSOR-expressing cells were harvested at the indicated time points after PMA or DMSO treatment. (f) Analysis of N-CISSOR bioactivity. Differentiated C2C12 myotubes were treated with conditioned medium from N-CISSOR-expressing cells or control cells. Recombinant NRG1 and its vehicle (BSA) were used as positive and negative controls, respectively. pErbB3 (185 kDa), pAkt (60 kDa), and β-actin (60 kDa) were detected in the lysates of C2C12 myotubes. (g) A merged image of GFP and mCherry in a N-CISSOR-expressing cell. Intracellular mCherry dots are indicated by arrows. Scale bar: 10 μm.