
|
Fig. 6
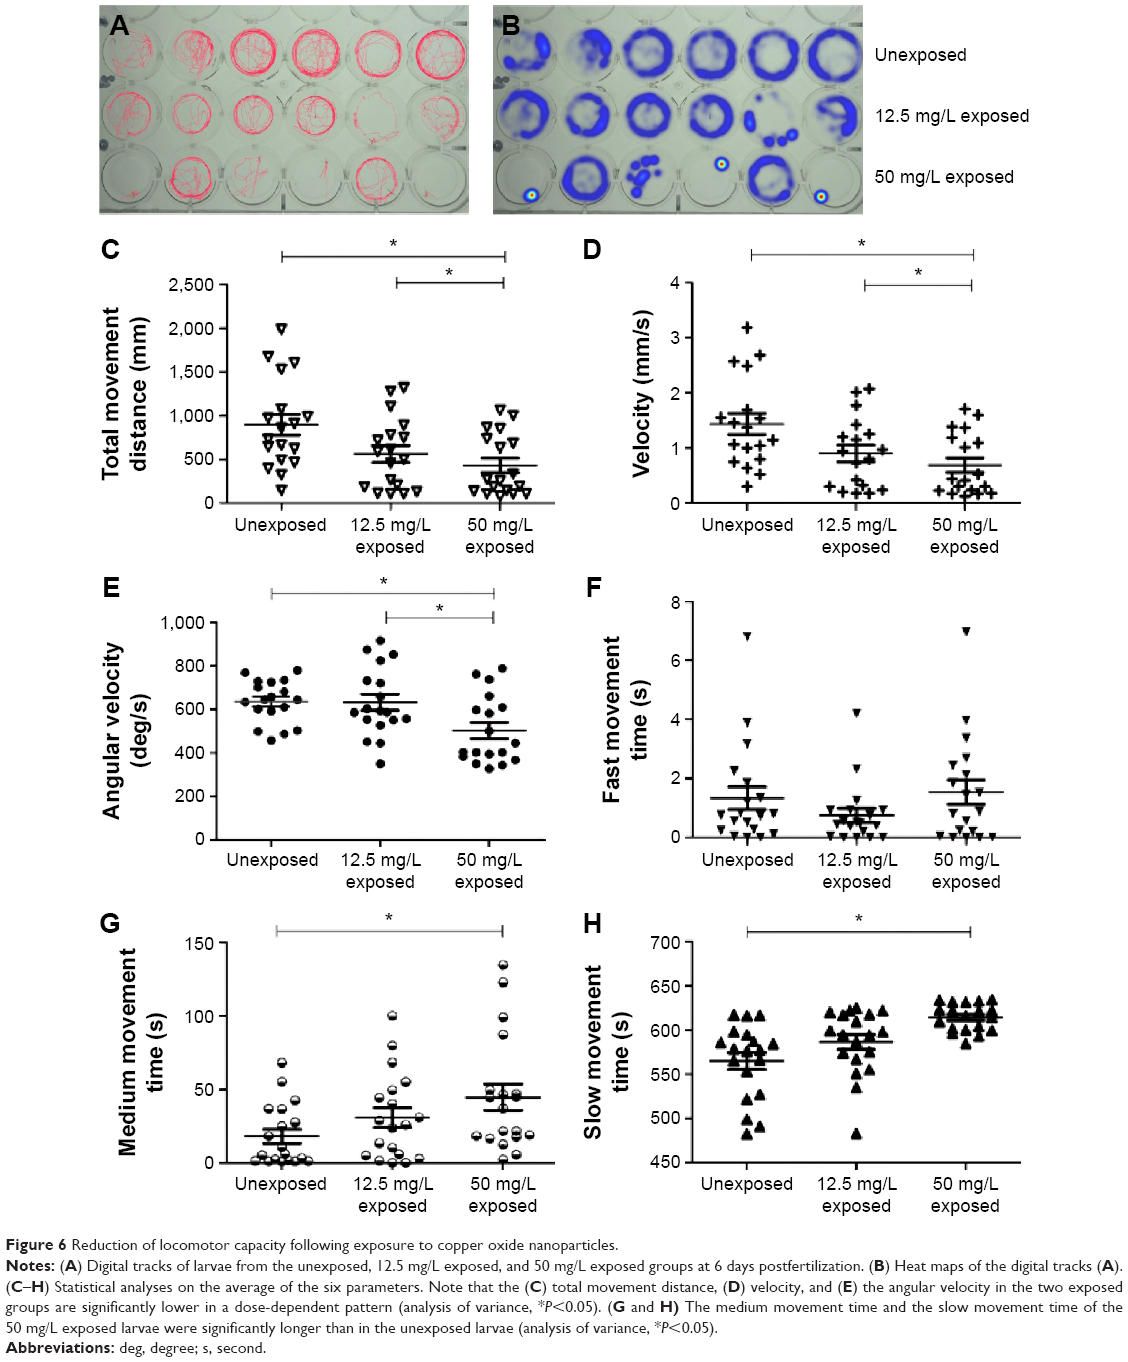
Reduction of locomotor capacity following exposure to copper oxide nanoparticles.
Notes: (A) Digital tracks of larvae from the unexposed, 12.5 mg/L exposed, and 50 mg/L exposed groups at 6 days postfertilization. (B) Heat maps of the digital tracks (A). (C–H) Statistical analyses on the average of the six parameters. Note that the (C) total movement distance, (D) velocity, and (E) the angular velocity in the two exposed groups are significantly lower in a dose-dependent pattern (analysis of variance, *P<0.05). (G and H) The medium movement time and the slow movement time of the 50 mg/L exposed larvae were significantly longer than in the unexposed larvae (analysis of variance, *P<0.05).
Abbreviations: deg, degree; s, second.