
Image
|
Figure Caption
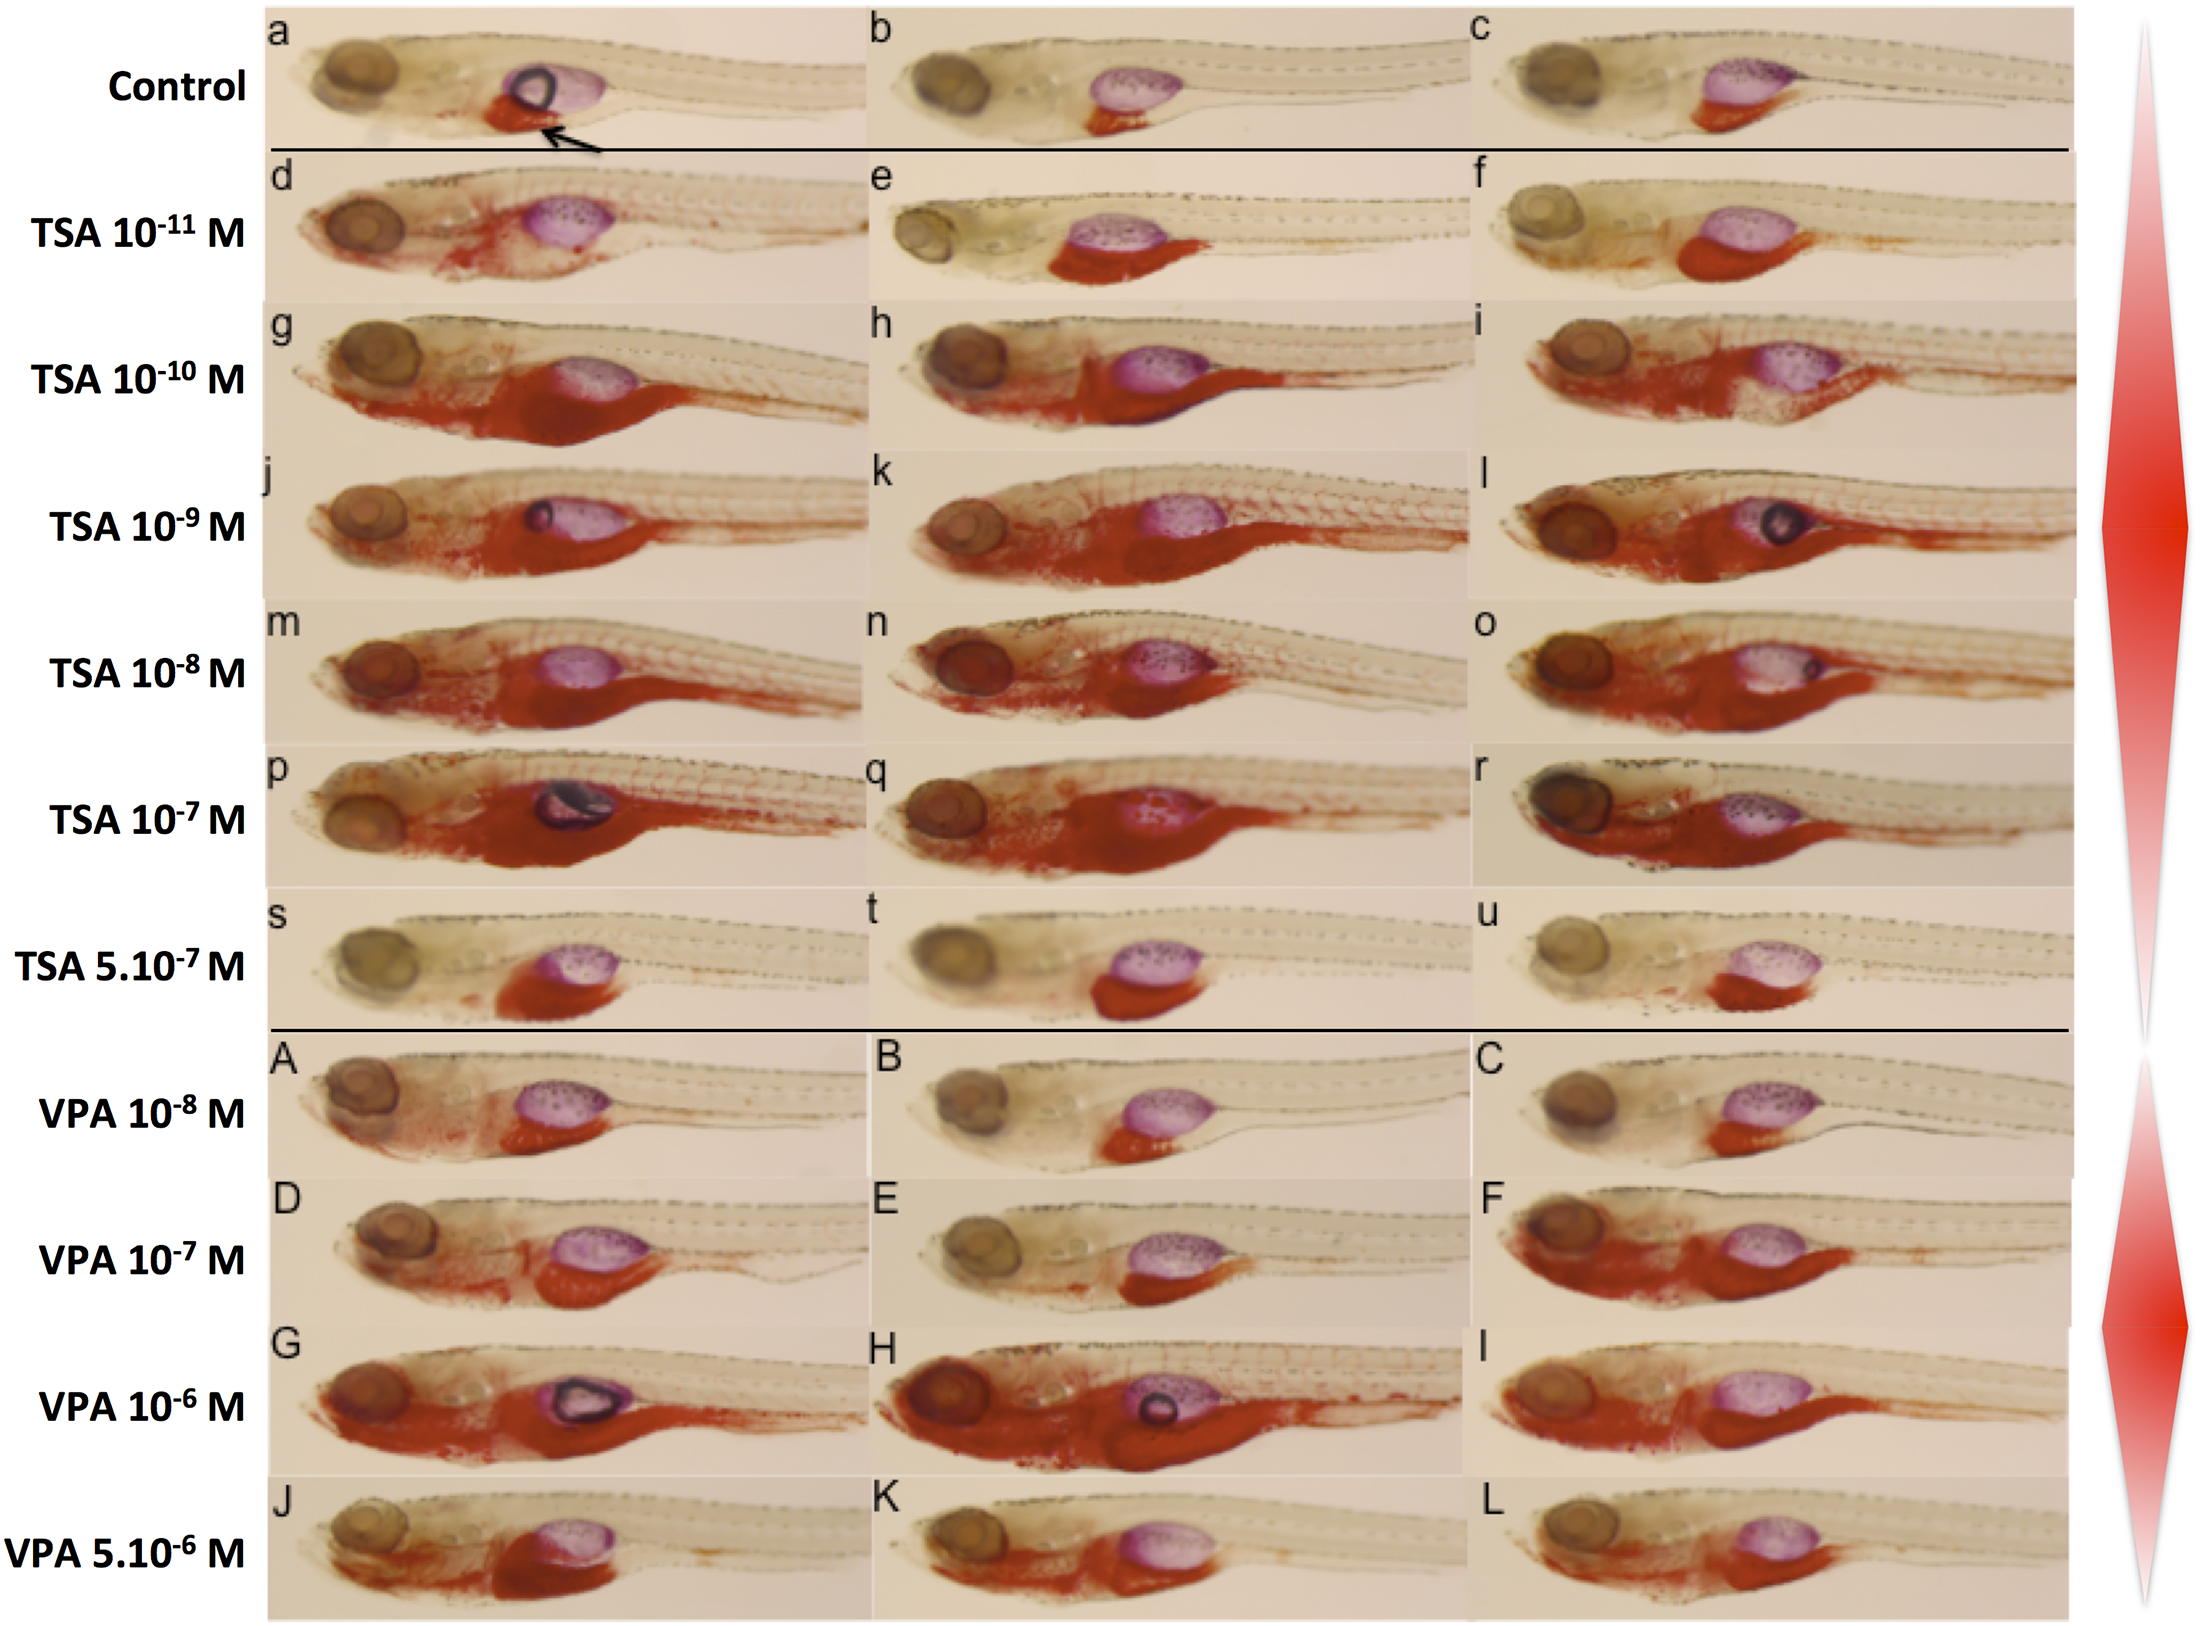
Fig. 5
Lipid accumulation in larvae treated with VPA and TSA.
Oil Red O staining shows the localization of neutral lipids in 10 dpf larvae that have been on a high fat diet between 6 dpf and 9 dpf. An arrow indicates the liver. Control embryos (a-c), embryos treated with increasing concentrations of TSA (d-u) or VPA (A-L). The red lozenges on the right schematize the lipid accumulation, highlighting the non-monotonic dose response. Note that the maximum accumulation is observed at intermediate concentrations.
Acknowledgments
This image is the copyrighted work of the attributed author or publisher, and
ZFIN has permission only to display this image to its users.
Additional permissions should be obtained from the applicable author or publisher of the image.
Full text @ PLoS One