
Image
|
Figure Caption
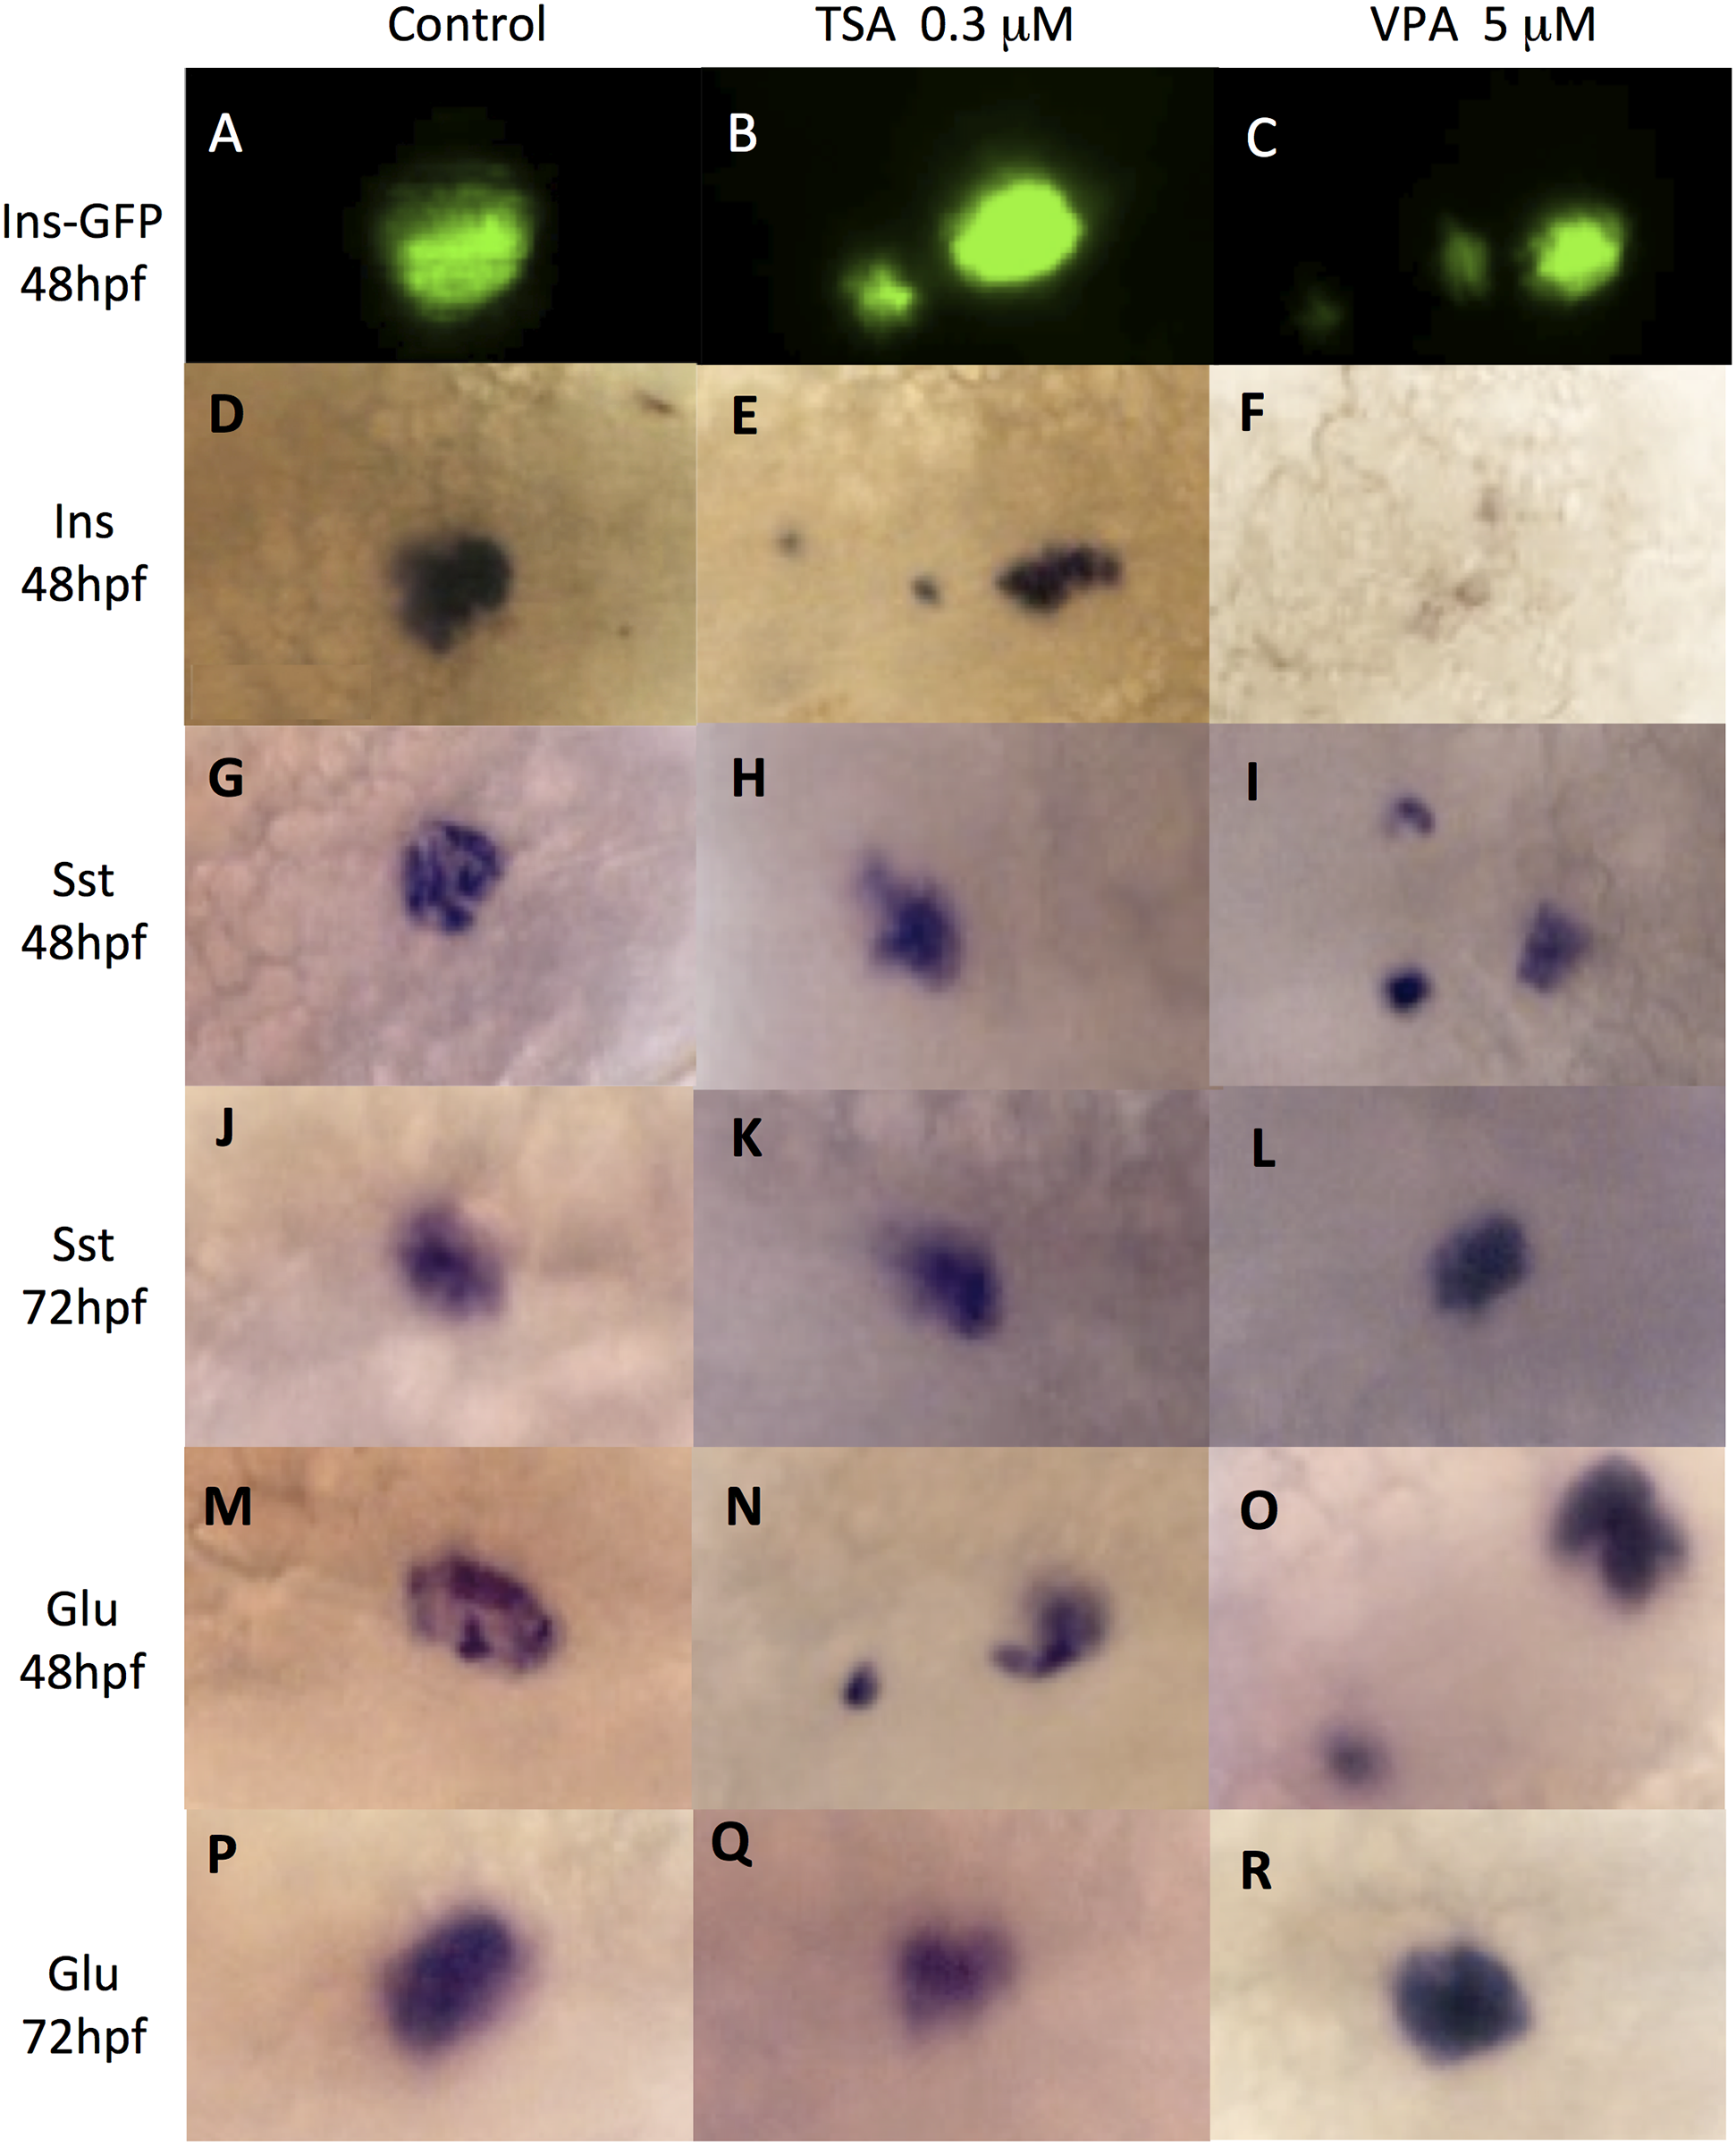
Fig. 3
VPA and TSA disrupt cells clustering in endocrine pancreas.
Cells of the endocrine pancreas are revealed in control embryos (A, D, G, J, M, P) or embryos treated with 0.3 μM TSA (B, E, H, K, N, Q) or 5 μM VPA (C, F, I, L, O, R). GFP fluorescence in β-cells of 48 hpf embryos of the insulin-GFP transgenic line (A, B, C). Whole-mount in situ hybridizations to detect the transcripts of: insulin in β-cells (D-F); somatostatin in δ-cells at 48hpf (G-I) or 72 hpf (J-L); glucagon in α-cells at 48hpf (M-O) or 72 hpf (P-R).
Acknowledgments
This image is the copyrighted work of the attributed author or publisher, and
ZFIN has permission only to display this image to its users.
Additional permissions should be obtained from the applicable author or publisher of the image.
Full text @ PLoS One