
|
Fig. 4
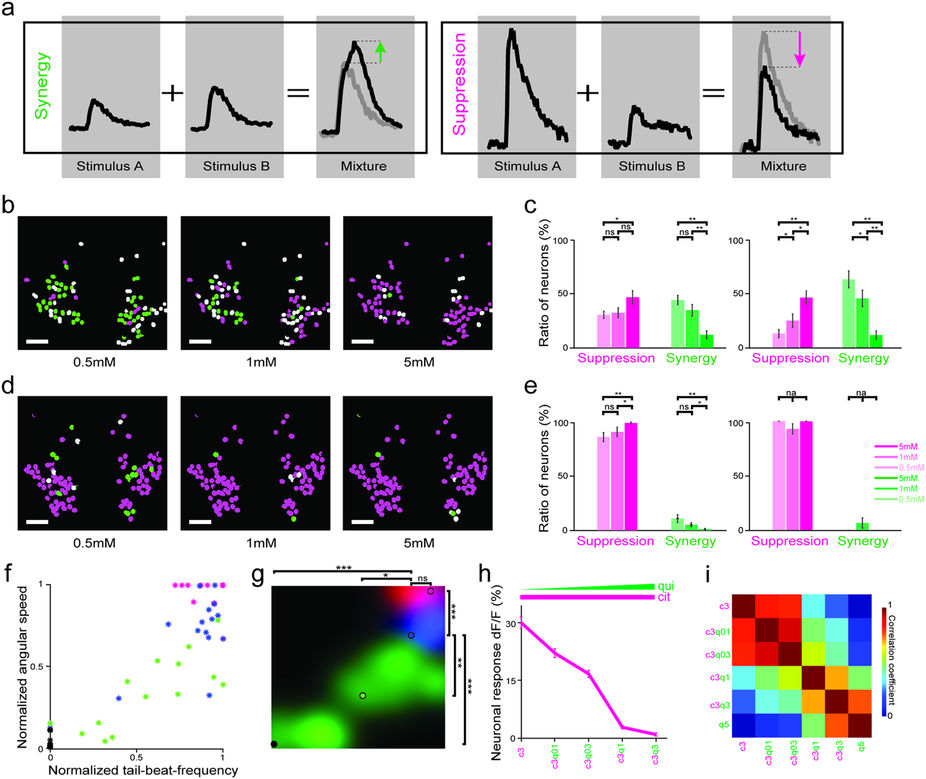
Taste mixtures exhibit suppressive and synergistic interactions, which are dynamically modulated by the taste concentration and category.
(a) Schematic representation for quantifying mixture interactions. Taste responses of two representative neurons, which show synergy (left) and suppression (right) respectively. Individual and mixtures taste responses(black) and predictions based on synergy and suppression rules as described in methods (grey). (b) Representative facial lobe neurons from individual zebrafish are color coded by the mixture interactions they exhibit (suppression = magenta, synergy = green, rest = grey) in response to mixtures of sour tastants (citric acid and malic acid) at different concentrations. (c) Ratio of all neurons (left) and responding neurons (right) exhibiting synergy or suppression changes dynamically with changing concentrations. N = 1129 neurons in 7 fish. (d) Representative facial lobe neurons are color coded for suppressive and synergistic interactions for the mixtures of sour (citric acid) and bitter (quinine-HCl) taste. White scale bars are 20 μm for b and d. (e) Ratio of all neurons (left) and responding neurons (right) exhibiting synergy or suppression for sour/bitter mixtures (for c and e ***p = <0.0005, **p = <0.005, *p < 0.05 by Wilcoxon signed-rank test, ns = not significant, n.a = not applicable). N = 490 neurons in 7 fish. Error bars are standard error of the mean across fish for c and e. (f) TBF and ATS of zebrafish in response to citric acid (magenta), quinine-HCl (green) and their mixture (blue) at 5 mM concentrations. Each dot represents a three trial average from individual fish (n = 15 fish) during first four seconds. Max ATS = 1.9 ± 0.7πrad/s. Max TBF = 24.8 ± 4.0 Hz. (g) Behavioral taste map obtained by Gaussian filtering the graph in f. Colored circles represent average values across all fish. All combinations generate significantly different behaviors (***p = <0.0005, **p = <0.005, *p < 0.05 by Wilcoxon signed-rank test, ns = not significant). (h) Dose dependent average amplitude for the neural responses to mixtures of citric acid and quinine-HCl. Citric acid concentration is kept at 3 mM and quinine-HCl concentration is gradually increased morphing the mixture responses. Error bars are standard error of the mean. (i) Pair-wise Pearson’s correlations between neural responses to morphing mixtures of citric acid and quinine-HCl. Note the abrupt change in the pairwise similarity of neural responses. N = 259 neurons in 10 fish.