
|
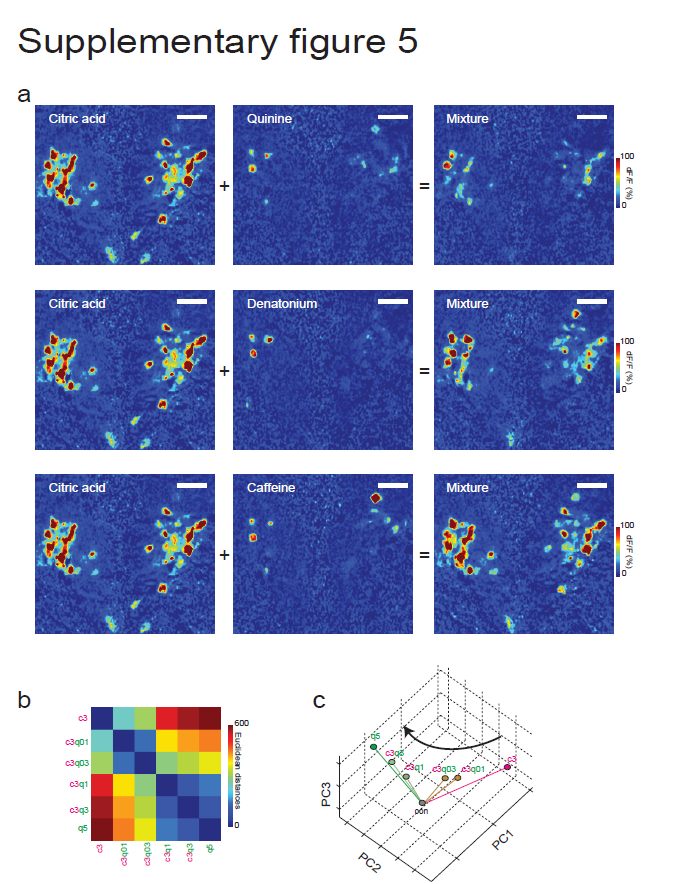
Fig. S5
Bitter tastants suppress sour taste responses when mixed together
a) Activity map in response to citric acid, caffeine, denatonium, quinine-HCl and citric acid mixed with these bitter substances, all molecules at 10mM each. Relative change in fluorescence intensity is color coded. Please note that quinine-HCl elicit the strongest suppression of citric acid responses when mixed together. White bars are 20 μm. Pair-wise Euclidean distances (b) and principle component representations (c) of neural responses to different citric acid/quinine-HCl mixtures. Note the sharp transition between the neural representations of taste mixtures both for Euclidean-distances and the first 3 principle component representations, similar to the pair-wise correlation coefficients in Figure 4i