
|
Fig. S1
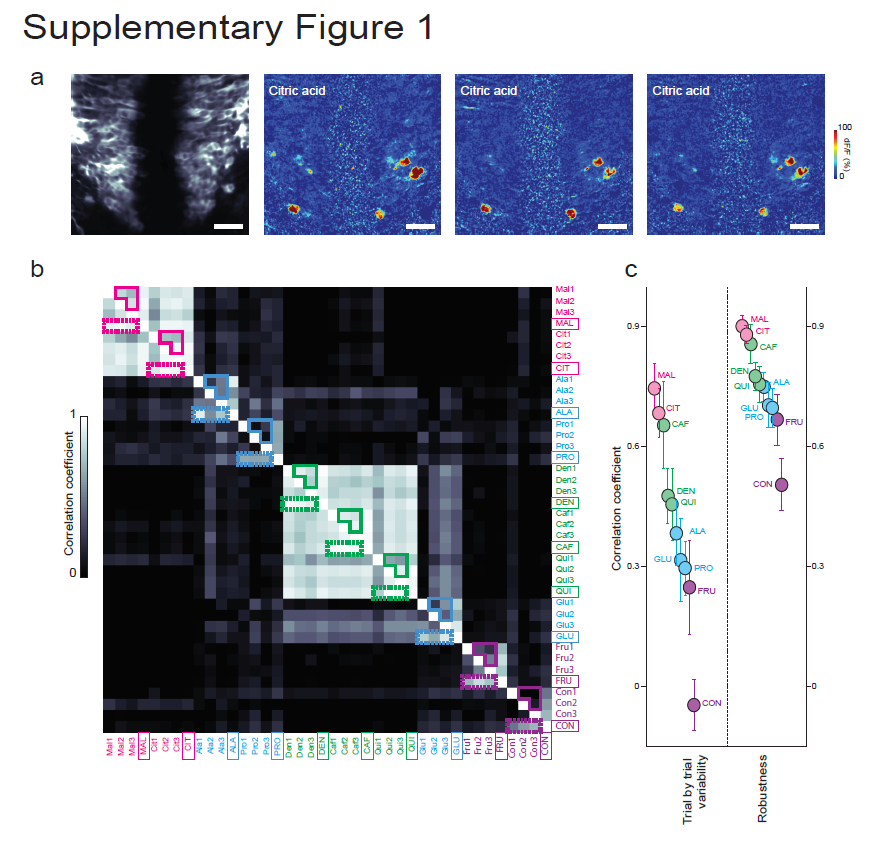
Reproducibility and robustness of taste responses.
a) An example for the reproducibility/trial-to-trial variability of the taste-evoked neural responses in zebrafish brainstem. b) Pair-wise Pearson’s correlations representing the trial-to-trial variability between neural responses to different tastants in the same fish as supplementary figure 1a. We measured reproducibility (solid boxes) by comparing trial-to-trial variability across same tastants. We also measured robustness (dashed boxes) by comparing individual taste trials to the averaged response to 3 trials of same taste. Note that the tastants with prominent responses e.g. sour, bitter compounds and amino-acids have low trial-to-trial variability and high robustness. In all of our analysis we used the 3 trial average of the taste responses to ensure reproducibility. c) Left: correlations across trial-to-trial variability in individual fish within individual tastants, same as solid boxes from supplementary figure 1b. Right: correlations of individual trials to the average response of all 3 trials (left), same as dashed boxes from supplementary figure 1b. Error bars represent the standard error of the mean.