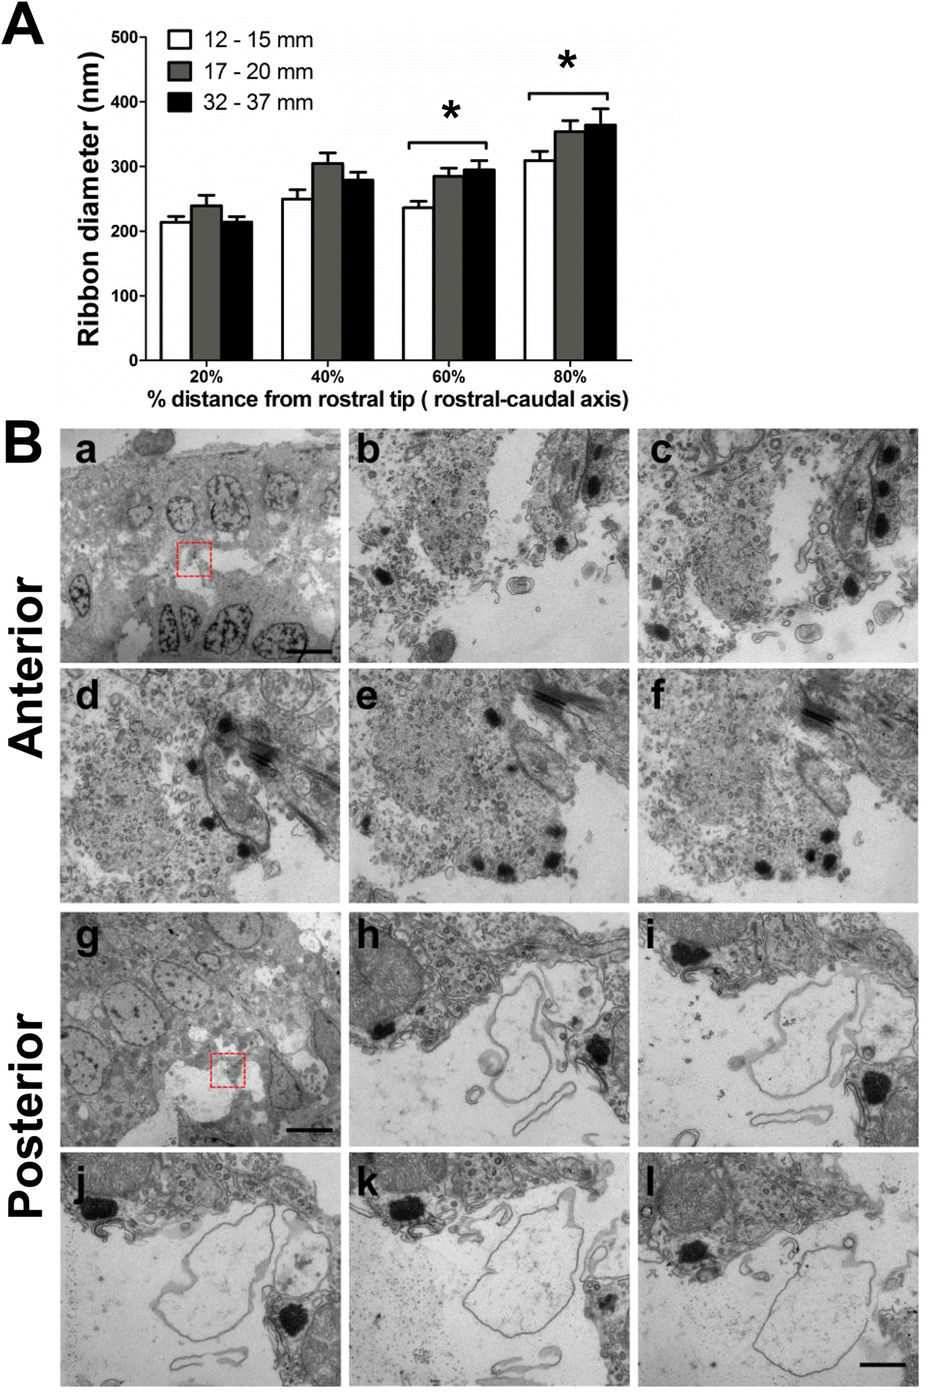
Fig. 8
Ribbon diameter across different TLs and regions.
(A) Comparison across three TL groups at four distances from the rostral end (0%, 20%, 60% and 80% distances) of the sensory epithelium (ribbon number observed at the four distances: n = 52, 36, 33 and 22, respectively, for 12–15 mm TL fish; n = 22, 24, 39 and 30, respectively, for 17–20 mm TL fish; and n = 52, 30, 37 and 16, respectively, for 32–37 mm TL fish). *P < 0.05, post hoc tests within each distance between the indicated TL groups. (B) Representative TEM images of serial sections. The HCs of the anterior saccule contained small ribbons that were close to each other (a–f), in contrast to the large, rounded and dispersed ribbons observed in HCs in the posterior saccule (g–l). The red rectangles in (a,g) indicate the regions that were magnified and observed in the serial sections (b–f and h–l, respectively). Scale bars: 5 μm (a and g); 500 nm in all magnified images.

