
IMAGE
Fig. 6
- ID
- ZDB-IMAGE-171030-3
- Publication
- Wang et al., 2015 - Ontogenetic development of the auditory sensory organ in zebrafish (Danio rerio): changes in hearing sensitivity and related morphology
- All Figures
- Figures for Wang et al., 2015
Image
|
Figure Caption
Fig. 6
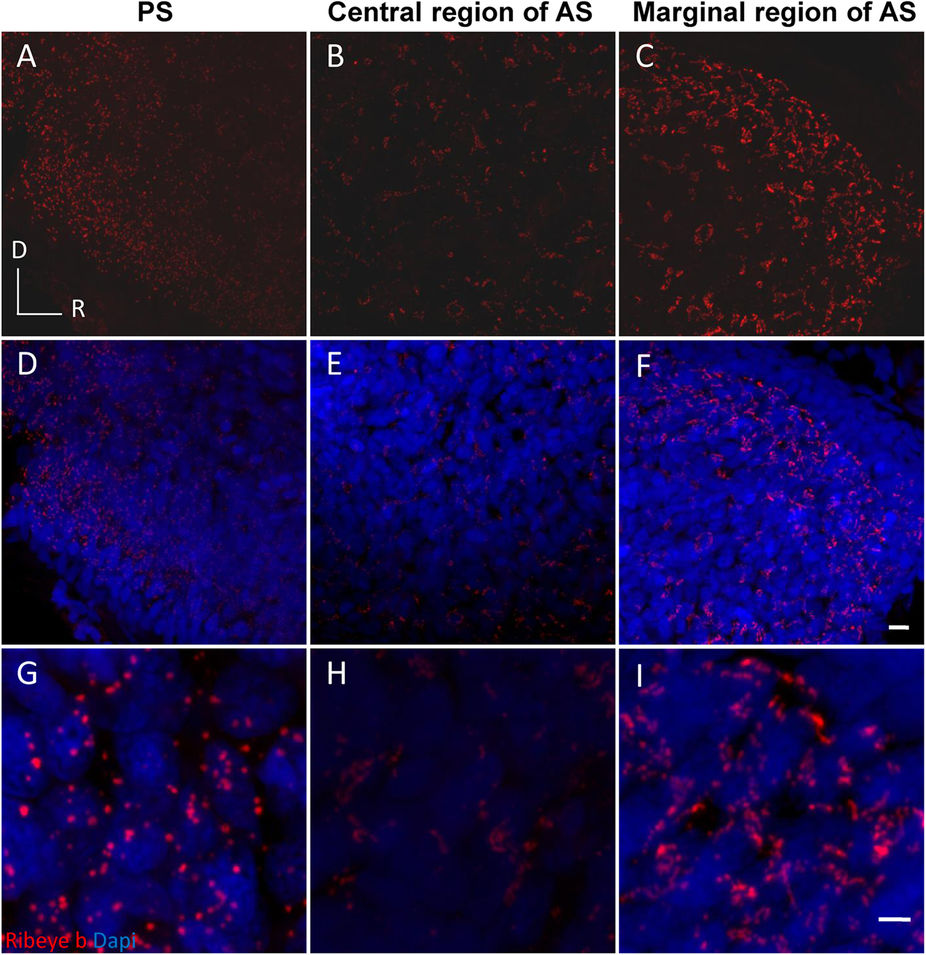
Representative images showing regional differences in Ribeye b expression in a 35 mm fish.
A dispersed distribution of round puncta (red) were observed in the posterior saccule (A,D,G). Clustered spots of labelling were observed in the marginal anterior saccule (C,F,I). Smaller but still clustered puncta were observed in the central region of the anterior saccule (B,E,H). (G–I) are magnified from (D–F), respectively. AS: anterior saccule; PS: posterior saccule; R and D: rostral and dorsal, respectively; scale bars: 5 μm (A–F) or 2 μm (G–I).
Acknowledgments
This image is the copyrighted work of the attributed author or publisher, and
ZFIN has permission only to display this image to its users.
Additional permissions should be obtained from the applicable author or publisher of the image.
Full text @ Sci. Rep.