
IMAGE
Fig. 5
- ID
- ZDB-IMAGE-171030-2
- Publication
- Wang et al., 2015 - Ontogenetic development of the auditory sensory organ in zebrafish (Danio rerio): changes in hearing sensitivity and related morphology
- All Figures
- Figures for Wang et al., 2015
Image
|
Figure Caption
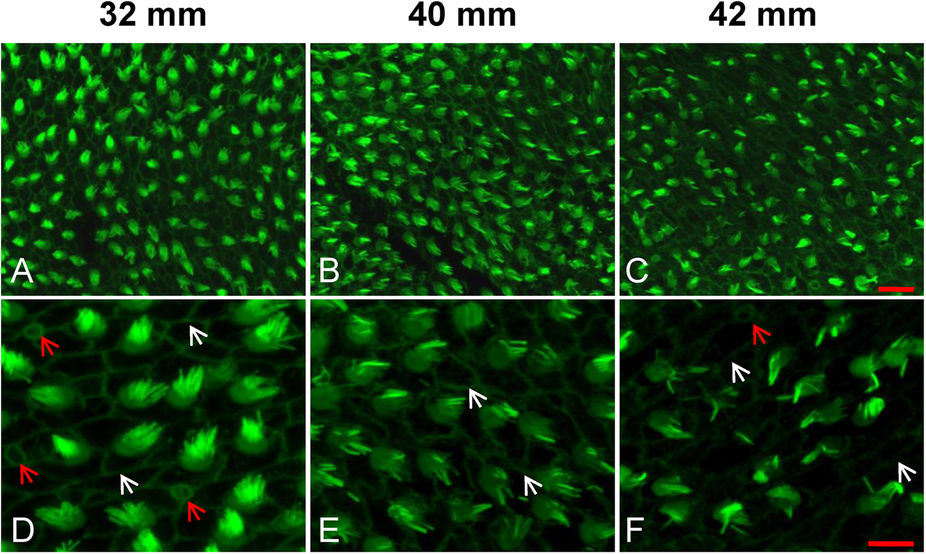
Fig. 5
Representative images showing the degeneration of HC bundles with age.
(A–C) Low magnification images of HC bundles in the anterior saccule of 32, 40 and 42 mm TL fish (6, 18 and 20 months, respectively). (D–F) High magnification images of (A–C). White arrows: cell-cell borders; red arrows: immature HCs; scale bars: 10 μm (A–C) or 5 μm (D-F).
Acknowledgments
This image is the copyrighted work of the attributed author or publisher, and
ZFIN has permission only to display this image to its users.
Additional permissions should be obtained from the applicable author or publisher of the image.
Full text @ Sci. Rep.