
Image
|
Figure Caption
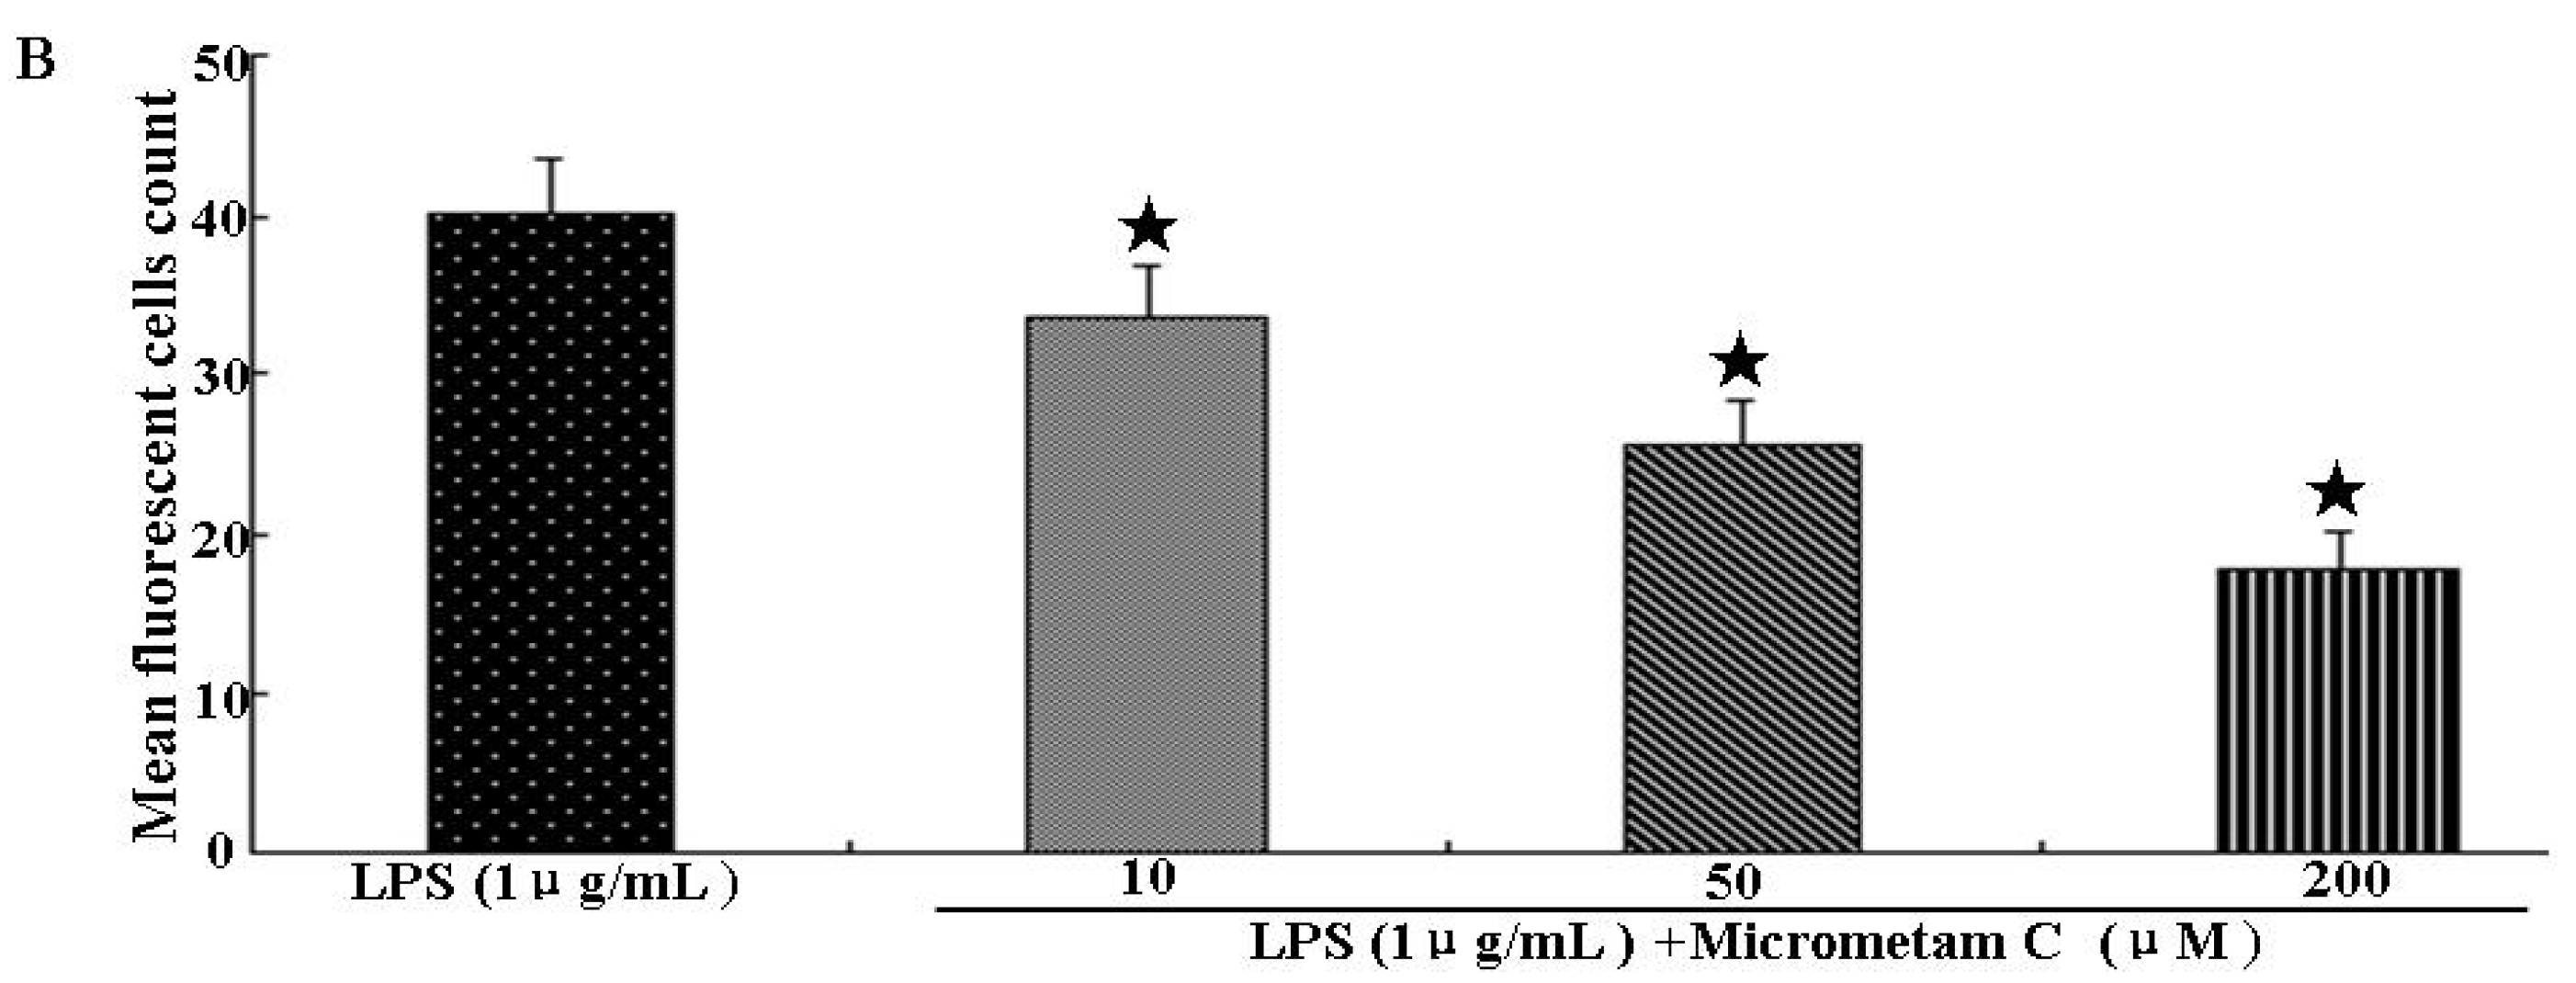
Fig. 1
Effect of micrometam C in inflammation-induced zebrafish model by tail-cutting. Experiments were performed in triplicate and the data are expressed as mean ± SEM. Fluorescent cells count are significantly different at p < 0.05 as analyzed by ANOVA. (* p < 0.01 vs. LPS).
Acknowledgments
This image is the copyrighted work of the attributed author or publisher, and
ZFIN has permission only to display this image to its users.
Additional permissions should be obtained from the applicable author or publisher of the image.
Full text @ Mar. Drugs