
IMAGE
Fig. S1
- ID
- ZDB-IMAGE-171020-9
- Publication
- Vincent et al., 2017 - Neutrophil derived LTB4 induces macrophage aggregation in response to encapsulated Streptococcus iniae infection
- All Figures
- Figures for Vincent et al., 2017
Image
|
Figure Caption
Fig. S1
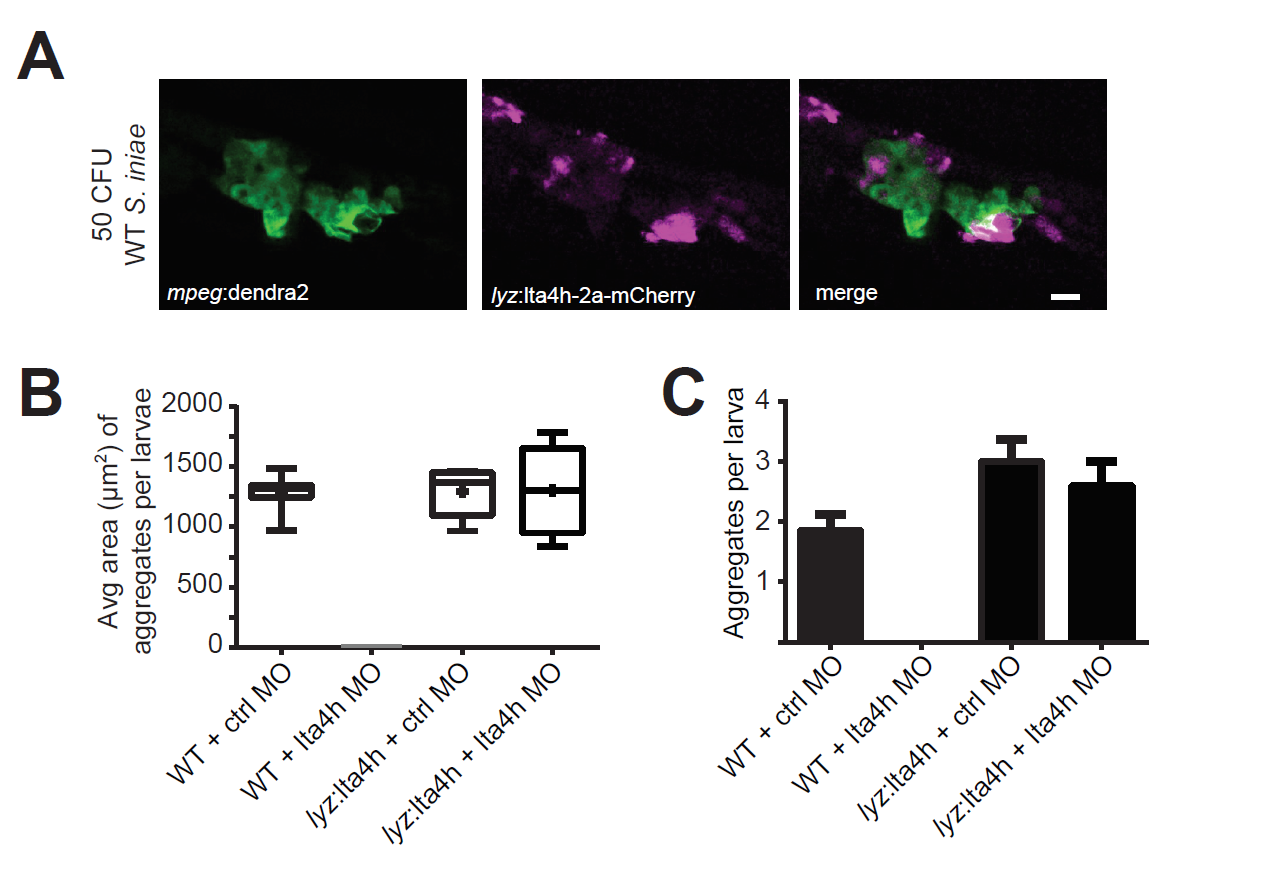
(A) Representative 63X images of macrophage aggregates in double transgenic Tg(mpeg:dendra2) x Tg(lyz:lta4h-2a-mCherry) larvae. Scale bar is 20 μm. (B) Average aggregate size, as measured by the peripheral area of aggregates, and (C) average number of aggregates per larvae at 24 hpi following infection with 50 CFU S. iniae in control or Lta4h morphants in a WT or Tg(lyz:lta4h) (lyz:lta4h) larvae background. Area and number were not statistically significant across all conditions.
Acknowledgments
This image is the copyrighted work of the attributed author or publisher, and
ZFIN has permission only to display this image to its users.
Additional permissions should be obtained from the applicable author or publisher of the image.
Full text @ PLoS One