
Fig. 2
- ID
- ZDB-IMAGE-171020-1
- Genes
- Publication
- Weh et al., 2017 - Functional characterization of zebrafish orthologs of the human Beta 3-Glucosyltransferase B3GLCT gene mutated in Peters Plus Syndrome
- All Figures
- Figures for Weh et al., 2017
|
Fig. 2
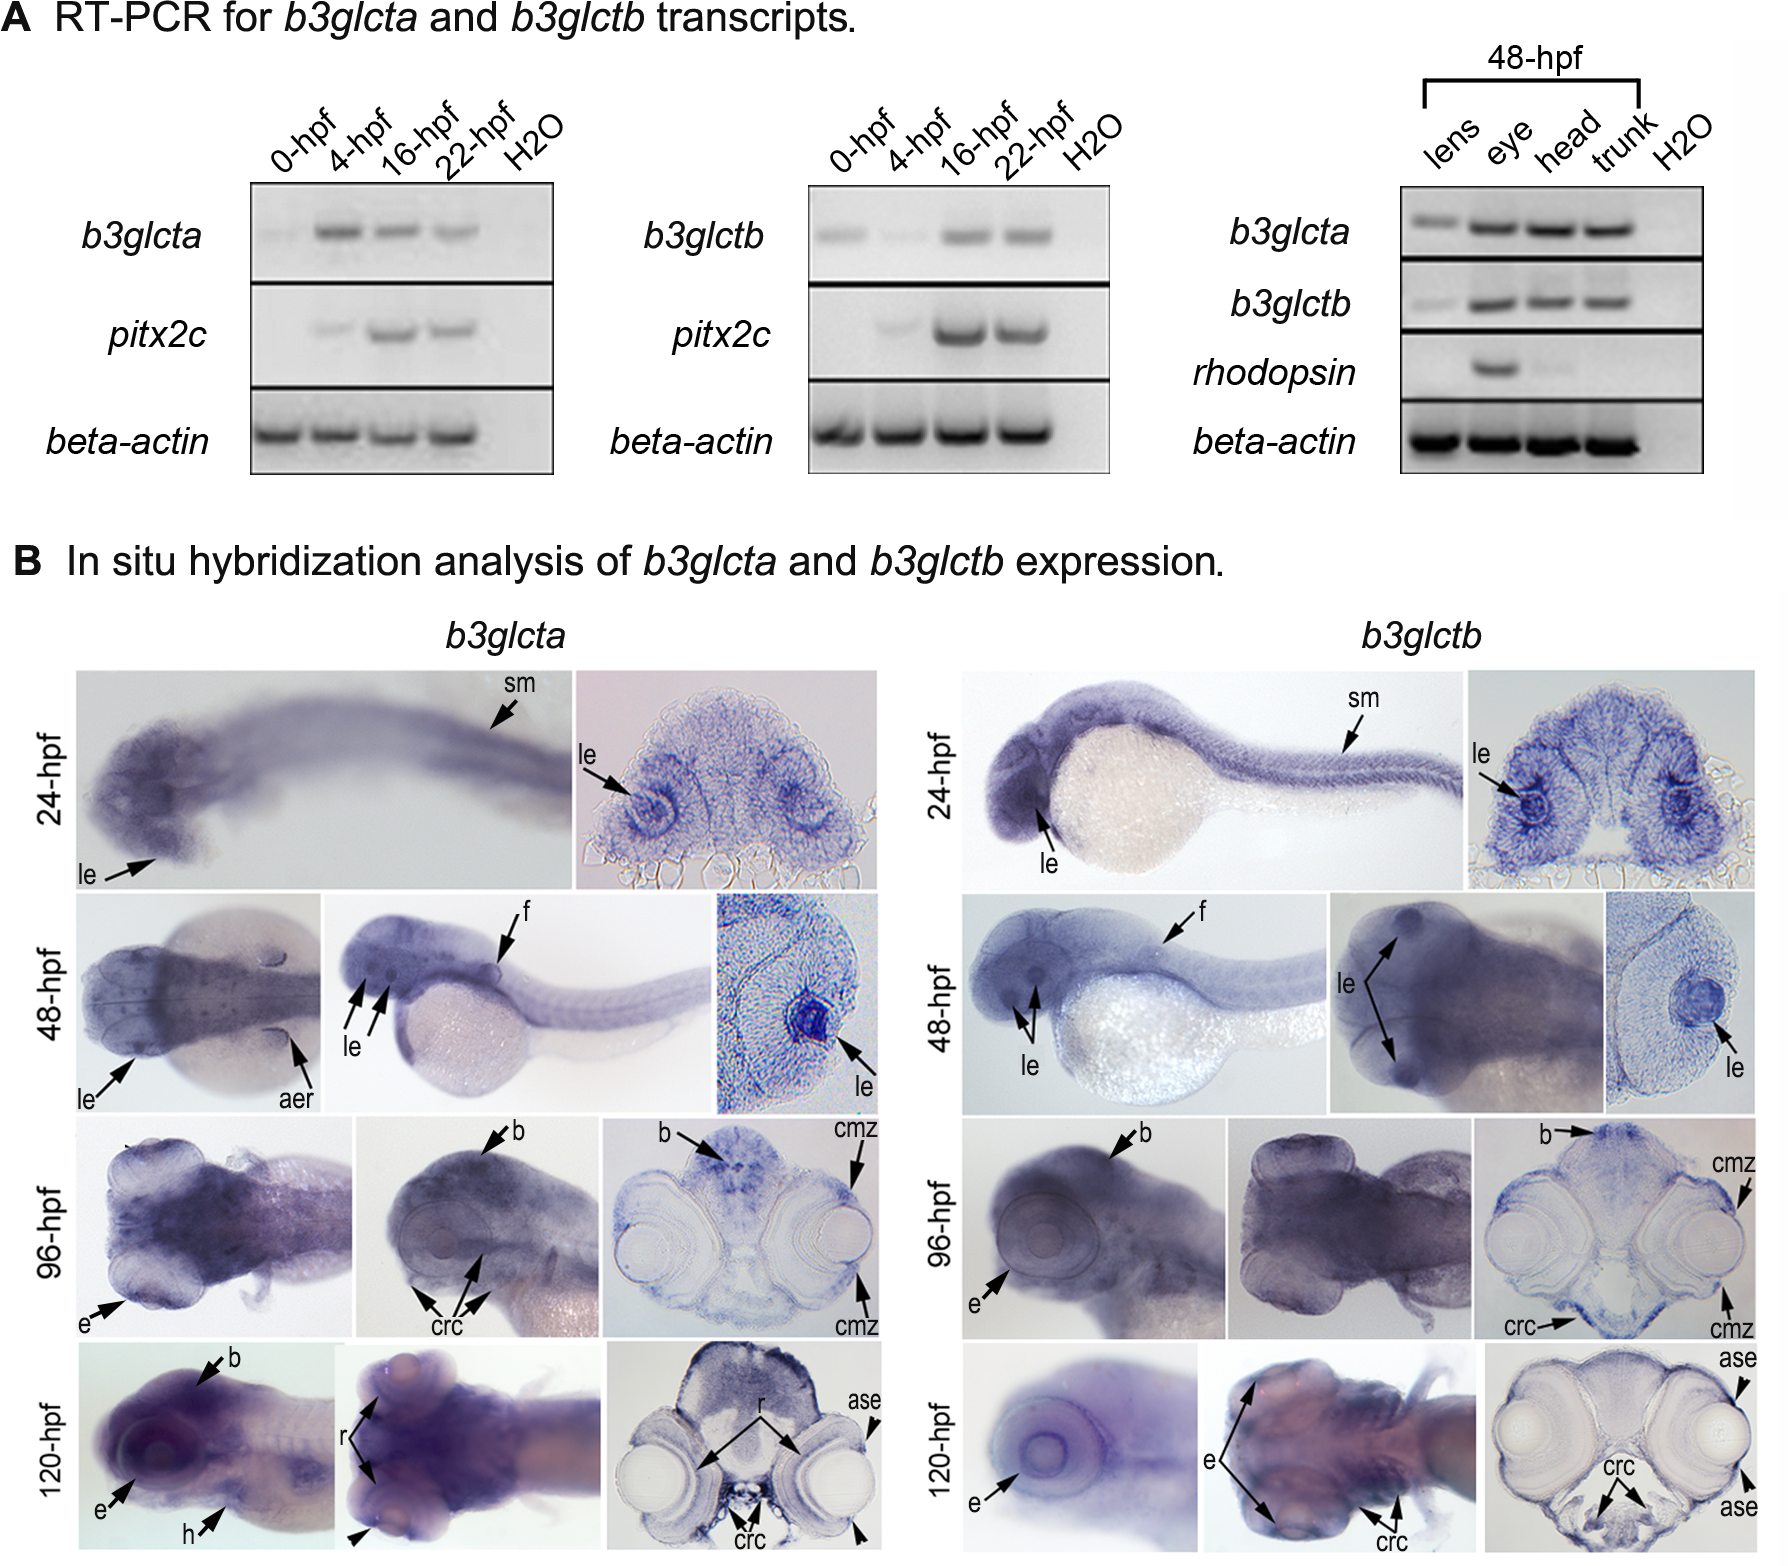
Embryonic expression of zebrafish b3glct genes.
(A) RT-PCR analysis of b3glct expression demonstrates robust expression of both b3glcta (left panel) and b3glctb (middle panel) at different stages of development in whole embryos as well as various embryonic tissues at 48-hpf (right panel). Controls included pitx2c as negative control for 0-hpf, rhodopsin as negative control for the lens, beta-actin as positive control for all tissues and H2O as negative contamination control for all reactions. (B) In-situ hybridization analysis of b3glcta and b3glctb expression demonstrates broad expression in 24-120-hpf embryos with enrichment in the developing eyes, fins, brain, craniofacial region and somites. aer–apical ectodermal ridge, ase–anterior segment of the eye, b–brain, cmz–ciliary marginal zone, crc–craniofacial cartilage, e–eye, f–fins, h–heart, le–lens, sm–skeletal muscles.