
Image
|
Figure Caption
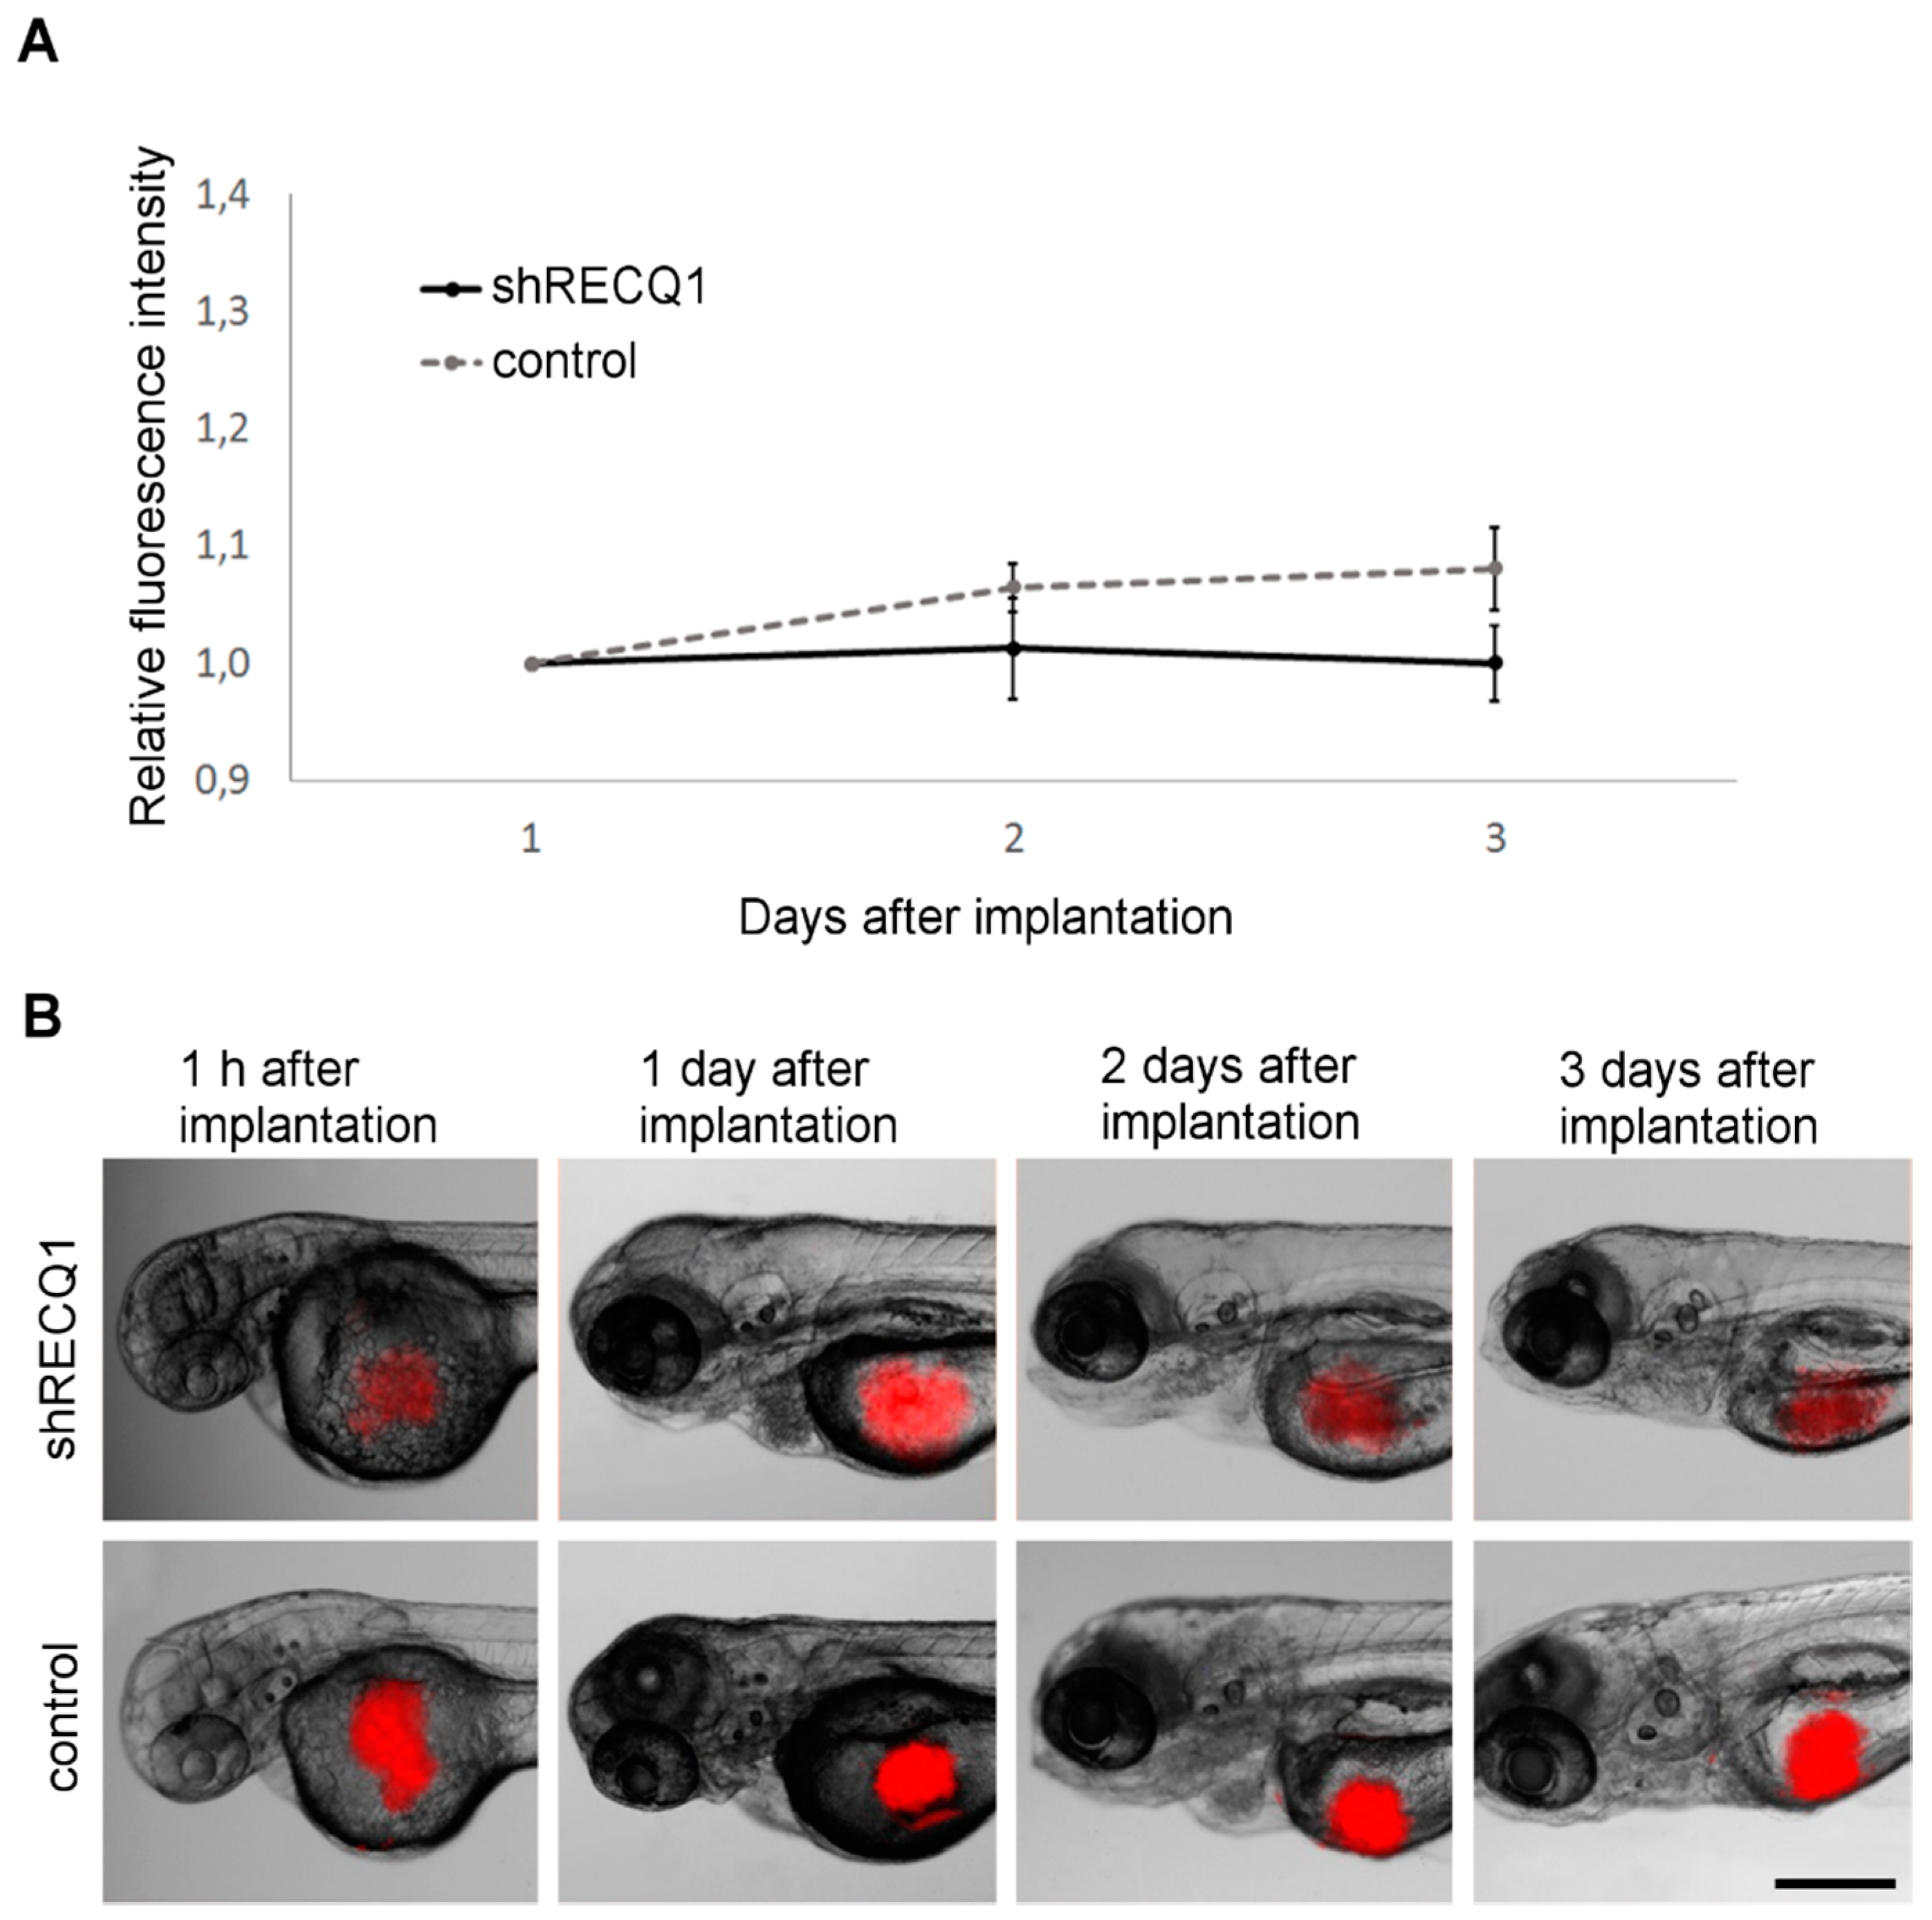
Fig. 4
Xenotransplantation of U87 DsRed cells in the yolk sac of zebrafish embryos. (A) Changes in DsRed fluorescence in the yolk sac between day 1 and day 3 after implantation. Means ± SE are shown. No significant increase in fluorescence intensity was observed in RECQ1-silenced or in the control U87 cells; (B) Sequential images of xenotransplants in the yolk sac of zebrafish embryos between 1 h and 3 days after implantation. Scale bar: 250 µm.
Acknowledgments
This image is the copyrighted work of the attributed author or publisher, and
ZFIN has permission only to display this image to its users.
Additional permissions should be obtained from the applicable author or publisher of the image.
Full text @ Genes (Basel)