
|
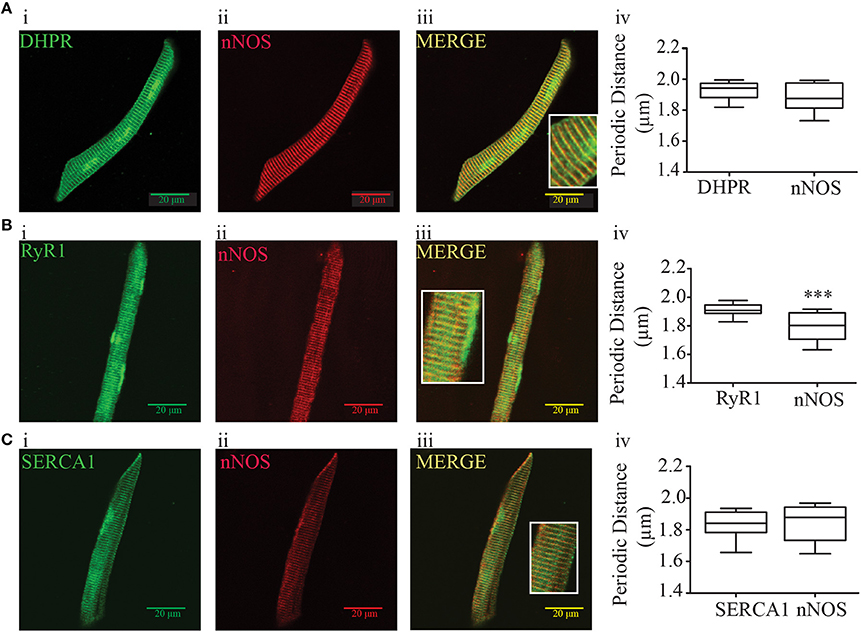
Fig. 2
Immunofluorescence and periodic distance analysis of DHPR, RyR, SERCA, and nNOS from zebrafish isolated myocytes. (A) Immunofluorescence for DHPR (i), nNOS (ii), and merge (iii), and periodic distance analysis (iv) from 26 cells. (B) Immunofluorescence for RyR (i), nNOS (ii), and merge (iii), and periodic distance analysis (iv) from 18 cells. (C) Immunofluorescence for DHPR (i), nNOS (ii), and merge (iii), and periodic distance analysis (iv) from 16 cells. The insert at the merged picture shows a magnification of the respective picture. Values are expressed as median; 25–75%. ***p < 0.001 vs. RyR immunofluorescence.