
Fig. 2
- ID
- ZDB-IMAGE-171004-20
- Publication
- Yao et al., 2017 - Screening in larval zebrafish reveals tissue-specific distributions of fifteen fluorescent compounds
- All Figures
- Figures for Yao et al., 2017
|
Fig. 2
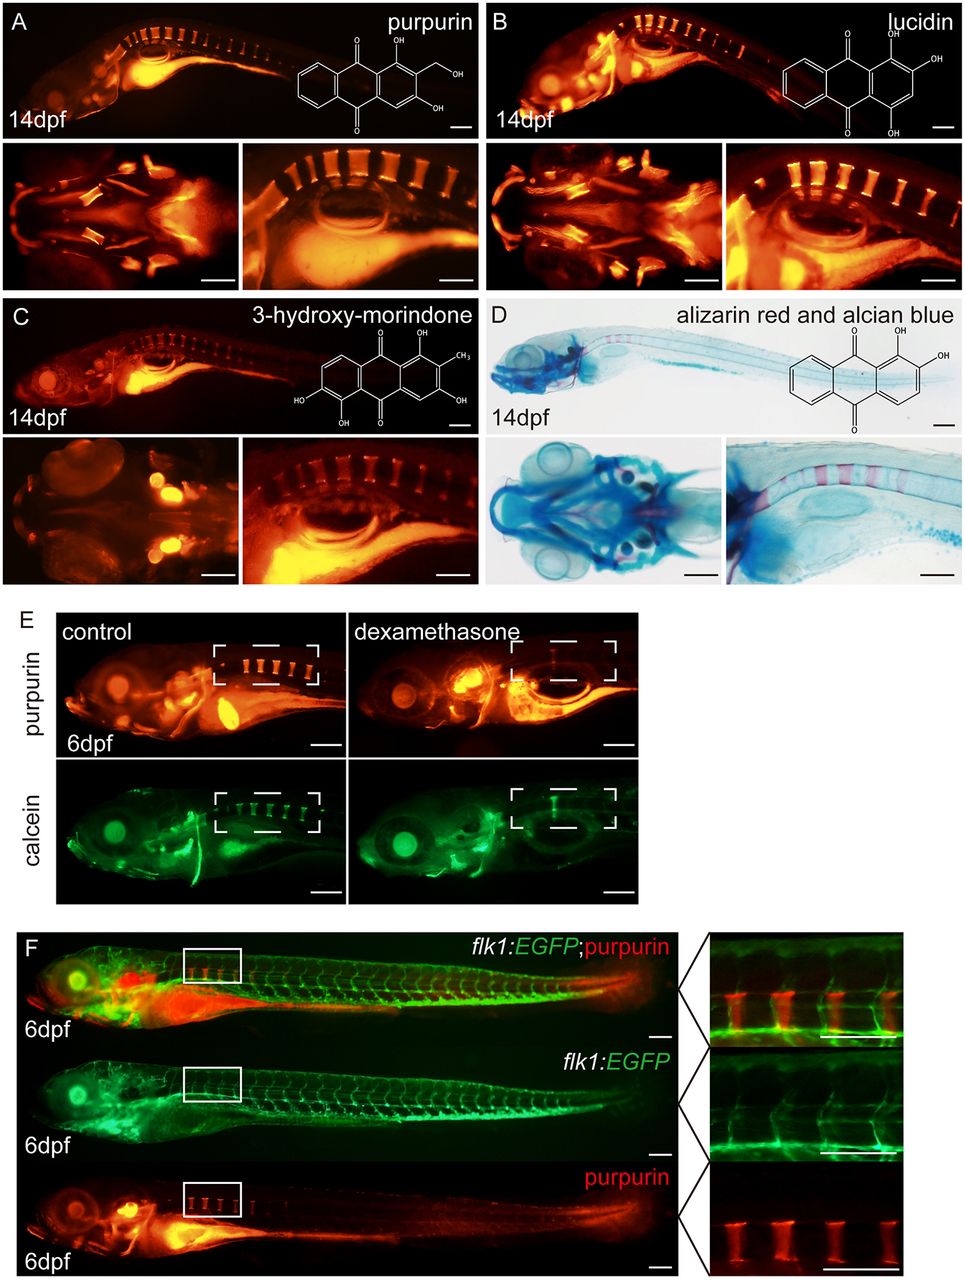
Purpurin, lucidin and 3-hydroxy-morindone label bones in zebrafish larvae. (A) Lateral and top views of the purpurin-treated zebrafish larva at 14 dpf, and the chemical structure of purpurin. Lateral view of whole zebrafish (top panel), the top view of the head (lower left panel), and the lateral view of the spine (lower right panel). Scale bars: 100 μm. (B) Lateral and top views of the lucidin-treated zebrafish larva at 14 dpf, and the chemical structure of lucidin. Lateral view of whole zebrafish (top panel), the top view of the head (lower left panel), and the lateral view of the spine (lower right panel). Scale bars: 100 μm. (C) Lateral and top views of the 3-hydroxy-morindone-treated zebrafish larva at 14 dpf, and the chemical structure of 3-hydroxy-morindone. Lateral view of whole zebrafish (top panel), the top view of the head (lower left panel), and the lateral view of the spine (lower right panel). Scale bars: 100 μm. (D) Lateral and top views of the Alizarin Red and Alcian Blue-stained zebrafish larva at 14 dpf. Lateral view of whole zebrafish (top panel), the top view of the head (lower left panel), and the lateral view of the spine (lower right panel). Scale bars: 100 μm. (E) Lateral views of the wild-type and dexamethasone-treated zebrafish larva at 6 dpf. Scale bars: 100 μm. (F) Lateral views of purpurin-treated Tg(flk1:EGFP) zebrafish larvae at 6 dpf. Scale bars: 100 μm.