
IMAGE
Fig. 1
- ID
- ZDB-IMAGE-171004-19
- Publication
- Yao et al., 2017 - Screening in larval zebrafish reveals tissue-specific distributions of fifteen fluorescent compounds
- All Figures
- Figures for Yao et al., 2017
Image
|
Figure Caption
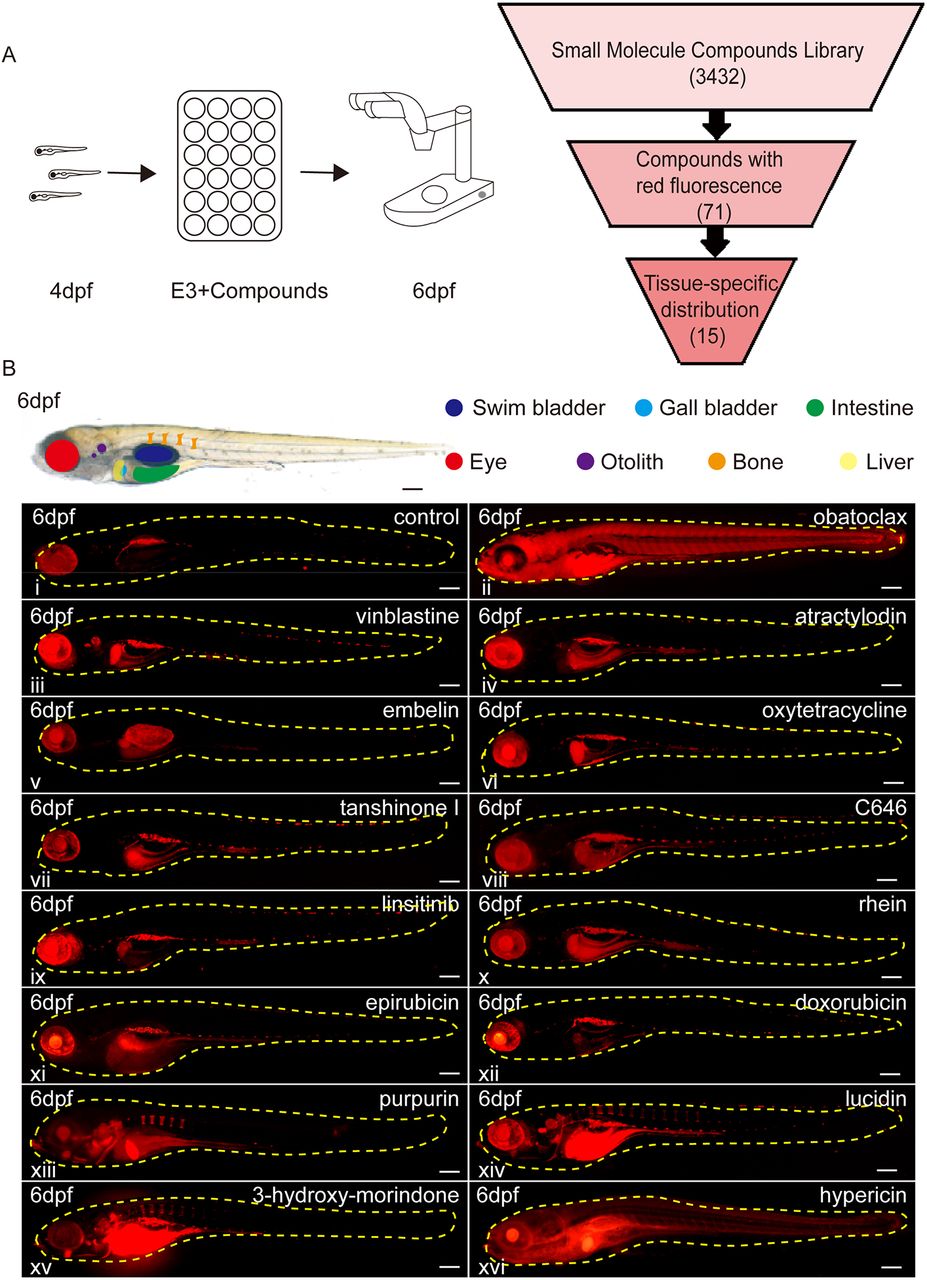
Fig. 1
Identification of red fluorescent compounds with tissue-specific distributions in zebrafish larvae. (A) An illustration of the screening process. (B) Whole mount lateral views of the zebrafish larvae at 6 dpf with tissue-specific distributions of the red fluorescent compounds. i: DMSO-treated zebrafish as control. Scale bars: 100 μm.
Acknowledgments
This image is the copyrighted work of the attributed author or publisher, and
ZFIN has permission only to display this image to its users.
Additional permissions should be obtained from the applicable author or publisher of the image.
Full text @ Dis. Model. Mech.